



Three months ago, a B2B SaaS product team showed me their roadmap spreadsheet. Every single feature had a "revenue impact" column filled with impressive numbers. $2M here, $800k there, another $3.5M for that enterprise integration. Added up, they should've been printing money.
Their actual MRR growth that quarter? 4%.
That disconnect isn't unique to them. Product teams everywhere run into the same broken pattern: sales promises features will unlock deals, customer success swears one enhancement will save three accounts, and executives push their pet projects with vague revenue projections. Meanwhile, actual revenue impact from shipped features stays frustratingly unpredictable.
Building a revenue-informed roadmap isn't about slapping dollar signs on every ticket. It's about creating a systematic way to track, validate, and learn from the actual commercial impact of your product investments. The teams that get this right share one specific trait — they treat revenue attribution like a product capability, not a spreadsheet exercise.
The fundamental disconnect between roadmap promises and revenue reality
Most product teams operate in a weird information vacuum. They get bombarded with revenue claims from every direction but rarely see the actual financial outcomes of what they ship. A typical scenario looks like this:
Sales logs a ticket claiming Feature X will unlock a $400k deal. Product ships it six weeks later. The deal closes three months after that for $280k. Nobody connects those dots. The feature gets marked "delivered" in Jira, the deal shows up in Salesforce, and any learning about the actual revenue relationship disappears.
This happens because product and revenue systems rarely talk to each other in meaningful ways. Your roadmap lives in Jira or ProductBoard or Azure DevOps. Revenue data sits in Salesforce or HubSpot. Customer feedback flows through Intercom or Zendesk. Financial reporting happens in spreadsheets or NetSuite. Each system tells part of the story, but nobody sees the whole picture.
The problem compounds when you factor in timing. A feature shipped today might impact revenue immediately (fixing a blocker for an active deal), gradually (improving retention over months), or eventually (enabling a new market segment next year). Without systematic tracking, those different revenue patterns blur into meaningless averages.
What makes this especially frustrating is that product teams genuinely want to make revenue-informed decisions. They're not ignoring commercial reality on purpose. They just lack the operational infrastructure to connect their work to actual financial outcomes consistently.
Why traditional prioritization frameworks fail at revenue attribution
RICE scores, value vs. effort matrices, weighted scoring models — every PM knows these. They work reasonably well for comparing features in abstract terms. They fall apart when you need actual revenue predictions.
Eliminate product chaos and align your team.
Itemyly helps you plan, prioritize, and track every product milestone seamlessly.
- Centralized roadmap management
- Stakeholder collaboration
- Release tracking & analytics
No credit card required
The core issue is that these frameworks treat all estimates equally. Your eng lead's effort estimate for a technical feature gets the same weight as a sales rep's revenue projection for their pet feature. One of those estimates comes from someone who builds software every day. The other comes from someone trying to close a deal.
Even when teams try to be more rigorous, they hit structural problems. Customer success might claim improving the reporting dashboard will reduce churn by 10% — but they're looking at support ticket volume, not actual retention data. Sales insists multi-language support will unlock the European market, but nobody's validated whether language is actually the blocker versus pricing, compliance, or product-market fit.
Traditional frameworks also miss the portfolio effect of revenue bets. If you're prioritizing ten features and eight depend on the same unvalidated assumption about customer behavior, you're not making ten bets. You're making one big bet with extra steps. A revenue-informed roadmap needs to account for those dependencies.
The frameworks themselves aren't broken. They're just not designed for the messy reality of revenue attribution. They assume clean inputs and rational actors. Real product decisions happen with partial information, competing agendas, and constant pressure to show commercial impact.
Building the operational foundation: ticket-to-dollar tracking that actually works
Creating real revenue visibility starts with one simple but powerful change: every feature request must include a revenue hypothesis that can actually be tracked.
Not "this will help with revenue" or "customers are asking for this." An actual hypothesis with a number, a timeframe, and a measurement method. Here's what that looks like in practice:
Revenue Hypothesis Template:
-
Specific claim
"This feature will..."
-
Revenue mechanism
(new sales / expansion / retention / efficiency)
-
Amount
$X over Y months
-
Measurement method
How we'll validate this
-
Confidence level
High/Medium/Low
-
Source
Who's making this claim and why
A real example from a project management software company:
"Adding Gantt chart views will enable us to win 3-4 enterprise deals currently stalled in evaluation, worth $240-320k in year-one ARR. We'll measure by tracking the 7 named opportunities currently citing this as a blocker, with first revenue impact expected 30-60 days post-launch. Confidence: Medium (based on direct customer feedback but no signed commitment). Source: Enterprise sales team with specific opportunity IDs."
This isn't perfect prediction — it's creating accountability. When the feature ships, you can check: did those deals close? At what value? How quickly? If not, why not?
The tracking system needs three components to function:
-
Upstream connection — Link every feature to its revenue hypothesis at creation time. This happens in your ticketing system with required fields or labels. No hypothesis, no prioritization.
-
Downstream validation — Connect completed features to actual revenue events. This usually means API integration between your product management tools and CRM, or at minimum a monthly reconciliation process.
-
Learning loops — Regular reviews comparing predicted versus actual revenue impact. Not to punish bad predictions, but to improve future estimates.
One mid-market B2B company implemented this and discovered something they didn't expect: their sales team was remarkably accurate at predicting deal values but terrible at predicting timing. Customer success was the opposite — great at timing, weak on amounts. They adjusted their estimation process accordingly, weighting different stakeholders' inputs based on proven accuracy patterns.
Make the revenue hypothesis a required ticket field so unvalidated requests can't quietly rise to the top.
Here's a simple visualization that helps teams align on the flow from ticket to revenue and back into learning cycles.
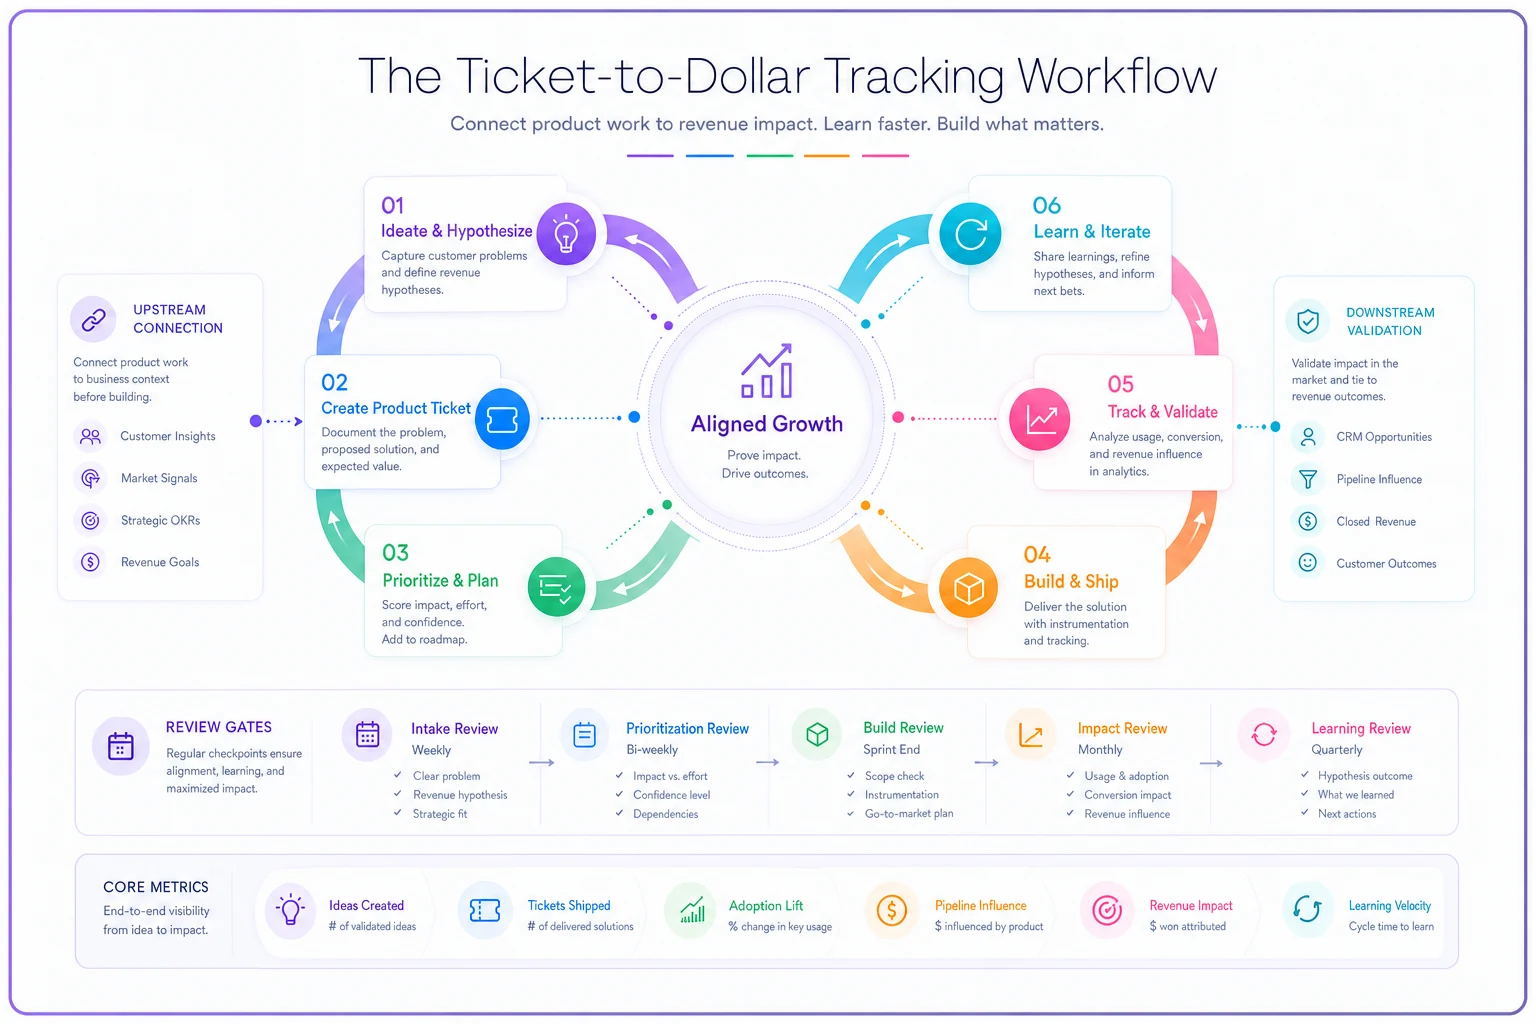
Use this flow to map who owns each integration point and where manual reconciliations are acceptable versus where automation is needed.
The ARR uplift calculation framework that strips away wishful thinking
Baseline ARR Trajectory
Before attributing any revenue to new features, establish your baseline growth rate. If you're growing 20% annually through existing capabilities, a new feature needs to drive growth above that baseline to count as uplift.
Incremental Revenue Categories:
-
Net-new ARR — Revenue from customers who explicitly bought because of the feature
-
Expansion ARR — Additional revenue from existing customers upgrading for the feature
-
Saved ARR — Revenue retained from customers who would've churned without the feature
-
Accelerated ARR — Revenue that arrived earlier because the feature removed a blocker
| Revenue Type | Validation Method | Confidence Signal |
|---|---|---|
| Net-new | Win/loss analysis mentions feature | Customer confirms in sales call |
| Expansion | Upgrade within 90 days of feature use | Usage data shows adoption before upgrade |
| Saved | Churn risk score improvement | Customer success notes + usage increase |
| Accelerated | Deal velocity change | Comparison to similar deals without feature |
The calculation gets more nuanced when you factor in costs. A feature might drive $500k in new ARR but require $200k in additional support overhead. Another might only generate $300k but cost nothing extra to maintain.
-
Net-new ARR
$340k (well below projection)
-
Expansion ARR
$180k (roughly on target)
-
Saved ARR
$420k (not originally projected at all)
-
Total uplift
$940k
The surprise wasn't missing the net-new number. It was discovering the feature's real value was retention, not acquisition. They'd been solving the wrong problem with the right solution.
Anti-gaming mechanisms: protecting roadmap integrity when everyone's revenue projections are inflated
The moment you tie roadmap priority to revenue projections, people start gaming the numbers. It's not malicious — it's just human nature plus incentive structures. Sales inflates deal sizes to get their features built. Customer success exaggerates churn risk to get attention. Product managers sandbag estimates to look like heroes when they exceed them.
Building anti-gaming mechanisms isn't about catching liars. It's about creating systems that naturally reward accuracy over inflation.
The Accuracy Score System
Track every revenue projection against actual outcomes, but weight recent predictions more heavily than old ones. Someone who was wrong six months ago but has been accurate lately gets more credibility than someone who was right once a year ago.
Score = (Actual Revenue / Projected Revenue) × Recency Weight × Confidence Factor
If someone projected $400k and delivered $100k, their score for that prediction is 0.25. Run this across all their predictions with more recent ones weighted higher and you get their overall accuracy score. Make these scores visible — not to shame people, but to create natural pressure for realistic estimates.
The Skin-in-the-Game Rule
Require stakeholders to specify what they'll trade off for their revenue bets. "If this feature doesn't deliver 80% of projected revenue, we'll deprioritize our next two requests." This sounds harsh but actually improves collaboration. Teams start validating each other's projections because they're all affected by bad bets.
The Progressive Commitment Gateway
Don't build the whole feature based on a revenue projection alone. Build the smallest valuable piece first, measure actual impact, then decide whether to continue. A CRM company wanted to build an entire AI-powered lead scoring system projected at $3M ARR. Instead, they built just the data import component first. When that only drove $200k in upgrades, they pivoted to a simpler scoring model that ended up delivering $1.8M.
The Multi-Source Validation Requirement
Any projection above a threshold (typically around $250k ARR) needs validation from at least two independent sources. Sales says a feature will unlock $500k? Get customer success to validate those accounts actually exist. Customer success claims something will save $300k in churn? Get finance to verify those accounts are actually at risk.
Governance rules that keep commercial asks from hijacking technical foundations
Every product team faces this dilemma: sales lands a huge deal contingent on a specific feature, but building it would create technical debt or break your architecture. You need governance rules that balance commercial pressure with product integrity.
The Technical Veto Threshold
If a commercially-driven feature would create more than X hours of additional maintenance work per month, engineering gets veto power unless the revenue exceeds Y threshold. One team uses 40 hours per month and $500k ARR as their thresholds. This isn't about engineering blocking business value — it's about making the true cost visible.
The Architecture Impact Assessment
-
Green (0-3)
Fits within existing architecture
-
Yellow (4-6)
Requires some architectural changes
-
Red (7-10)
Requires significant architectural changes
Yellow and red features need executive approval beyond just product leadership. This prevents death by a thousand cuts where each commercial ask seems reasonable in isolation but collectively degrades your codebase.
The Fast-Track Lane with Boundaries
-
Create a separate fast-track process for urgent commercial requests, but cap it at 20% of engineering capacity.
-
Deal must be above $X in ARR (usually 5% of your average contract value)
-
Customer must sign a letter of intent
-
Feature must be achievable within one sprint
-
No more than two fast-track items per quarter per team
The Commercial Debt Register
Just like technical debt, track "commercial debt" — features built purely for revenue that don't align with product strategy. When this debt exceeds around 30% of your codebase, pause all new commercial asks until you've paid it down through refactoring or sunsetting. This prevents the gradual drift toward becoming a custom development shop.
Worked example #1: B2B SaaS discovering their enterprise integration was worth 10% of projected value
DataSync, a B2B integration platform, had a clear revenue hypothesis: building a Salesforce integration would unlock the enterprise segment, worth $4M in new ARR within 12 months. Sales had fifteen enterprise prospects who'd "definitely buy" with this integration.
They invested four engineers for three months. Built a comprehensive bi-directional sync with custom object support. Launched with fanfare.
Six months later, the actual revenue impact was $380k.
Here's what their revenue-informed roadmap process revealed:
The Initial Hypothesis (what sales promised):
-
15 enterprise deals blocked solely by lack of Salesforce integration
-
Average deal size
$260k ARR
-
Close rate with integration
80%
-
Timeline
3-6 months post-launch
The Tracking Reality (what actually happened):
-
4 of 15 prospects had already bought competing solutions
-
5 of 15 wanted Salesforce plus three other integrations
-
3 of 15 were using Salesforce as a negotiation tactic
-
3 of 15 actually bought (at $120k average, not $260k)
The post-mortem revealed the real issue: they'd asked "what integrations do you need?" instead of "would you buy today if we had Salesforce integration?" The difference between those two questions was worth $3.6M in misallocated engineering resources.
Their new process requires progressive validation:
-
Mockup validation
Show prospects a realistic mockup. Track who schedules a follow-up.
-
Pilot commitment
Build a minimal version. Require paid pilot participation.
-
Full build trigger
Only proceed if 3+ pilots convert at projected price points.
Progressive validation isn't just a safeguard — it's a learning accelerator. Each gate forces a real signal before more investment flows in.
Worked example #2: Customer success correctly predicting retention impact but missing expansion opportunity
A project management platform's customer success team pushed hard for better permission controls. Their revenue hypothesis: "This will prevent $800k in annual churn from security-conscious customers."
They meticulously tracked every customer who mentioned permissions during churn interviews. Built a solid case. Got the feature prioritized and built.
Results after nine months:
-
Prevented churn
$730k (91% accurate)
-
Unexpected expansion
$1.2M
-
Total impact
$1.93M (241% of projection)
The surprise was that permission controls enabled department-level rollouts at existing customers. IT departments who'd previously restricted the tool to single teams could now expand usage while maintaining control.
What their tracking revealed:
-
Customer success was laser-focused on their metric (churn) and completely missed adjacent opportunities
-
Features that solve compliance, security, or control issues tend to have natural expansion potential
-
Their estimation process needed a standard "expansion check" for certain feature categories
They now use a multi-lens evaluation for every feature:
-
Primary hypothesis (the main revenue driver)
-
Adjacent impact check (could this affect other revenue streams?)
-
Strategic value modifier (does this unlock future capabilities?)
This isn't about making everyone predict everything — that way lies analysis paralysis. It's about systematically checking for patterns you've already seen in the data.
Integrating revenue intelligence into sprint planning without creating chaos
The worst way to implement revenue-informed roadmaps is to suddenly make every sprint planning session about money. Engineers don't want to hear about ARR during estimation. Designers shouldn't have to justify every pixel in revenue terms.
The integration approach that actually works follows a tiered rhythm:
Quarterly Revenue Planning → Monthly Roadmap Adjustment → Sprint Execution
At the quarterly level, use revenue intelligence to set major priorities. This is where you compare the $2M enterprise feature against the $500k quality-of-life improvements against the $1M technical platform investment.
Monthly, you adjust based on new information. That enterprise feature might be trending toward $500k based on pilot feedback. The quality-of-life improvements might be showing unexpected expansion potential. You don't thrash the entire roadmap, but you adjust sequencing and resource allocation.
At the sprint level, revenue mostly disappears from the conversation. Teams know why they're building what they're building from quarterly planning. Sprint planning focuses on how to build it well.
The Revenue Champion Model
Designate one person per squad as the revenue champion. They're responsible for tracking the revenue hypothesis for their squad's work, gathering validation data during development, reporting impact post-launch, and flagging when assumptions appear wrong. This isn't a full-time role — usually a PM or squad lead adds it to their responsibilities. But having someone explicitly own this prevents it from falling through the cracks.
The Three-Sprint Horizon
Keep revenue discussions focused on work starting 2-3 sprints out. Current sprint is locked. Next sprint is mostly locked. The sprint after that is where revenue intelligence affects prioritization. This gives teams stability while keeping commercial responsiveness intact.
Example weekly flow:
-
Monday
Squad reviews revenue performance of recently shipped features
-
Wednesday
Leadership reviews revenue projections for next month's work
-
Friday
Stakeholders can submit new revenue-validated requests
This rhythm prevents constant re-prioritization while keeping revenue intelligence fresh.
What happens when you finally connect roadmap decisions to real revenue outcomes
Companies that successfully implement revenue-informed roadmaps tend to see three major shifts.
Prediction accuracy improves — not overnight, but steadily. Teams get better at estimating because they see the actual results of their estimates. A typical progression looks like: months 1-3, predictions off by 200-300%. Months 4-6, off by 100-150%. Months 7-12, off by 40-60%. Year two and beyond, consistently within 30%.
Resource allocation becomes evidence-based. Instead of political battles over roadmap priorities, discussions center on validated data. "Platform infrastructure" stops being a hard sell when you can show that previous platform investments drove $X in engineering efficiency, enabling more features that drove $Y in revenue.
The organization also just learns faster. When everyone sees the real revenue impact of product decisions, organizational learning accelerates. Sales gets better at identifying real blockers versus negotiation tactics. Customer success gets better at identifying true retention drivers. Product gets better at sequencing bets for maximum learning.
The technology and process infrastructure you need to make this sustainable
Building a revenue-informed roadmap isn't a one-time project. It requires sustained operational infrastructure.
Data Pipeline Requirements:
-
CRM to product management tool integration (bidirectional)
-
Usage analytics to revenue data mapping
-
Support ticket to feature request tracking
-
Financial system to product metrics connection
You don't need perfect real-time integration. Even monthly batch uploads work if they're consistent. The key is systematic connection, not speed.
Process Infrastructure:
-
Revenue hypothesis templates in your ticketing system
-
Accuracy scoring calculations (a spreadsheet works fine initially)
-
Regular review cadences (monthly minimum)
-
Clear escalation paths for major misses
Organizational Alignment:
-
Defined roles for revenue tracking
-
Accuracy metrics in stakeholder KPIs
-
Protected time for validation work
-
Executive support for saying no to ungoverned requests
Start with the minimum viable version. A spreadsheet, manual updates, and monthly reviews beat a perfect system that never ships. One team ran their entire revenue-informed roadmap process through Google Sheets for eight months before investing in tooling. They wanted to prove the value first. That's the right call.
Common failure modes and how to prevent them
Failure Mode 1: The Perfection Paralysis. Teams spend months designing the perfect attribution system and never actually start tracking. Prevention: Start with three features this month. Track them manually. Improve from there.
Failure Mode 2: The Blame Game. The first bad prediction triggers finger-pointing and people stop making predictions altogether. Prevention: Celebrate learning from misses. Make accuracy scores about improvement, not punishment.
Failure Mode 3: The Override Spiral. Executives keep overriding the system for "strategic" bets and the team stops trusting the process. Prevention: Create an explicit override budget (two per quarter, for example) and track their outcomes too.
Failure Mode 4: The Complexity Explosion. The system becomes so complex that nobody understands how decisions get made. Prevention: If you can't explain your prioritization in two sentences, it's too complex.
Failure Mode 5: The Revenue Myopia. Everything becomes about immediate revenue, killing innovation and platform health. Prevention: Reserve around 30% of capacity for non-revenue work. Track its indirect impact over longer timeframes.
Making revenue intelligence a competitive advantage, not just a reporting burden
The companies that win with revenue-informed roadmaps treat them as a strategic capability, not a compliance exercise. They're not just tracking revenue — they're building a learning system that compounds over time.
Every feature you ship teaches you something about your market, your customers, and your ability to predict value. Most companies throw away those lessons. They ship, celebrate or commiserate, and move on. The learning evaporates.
Revenue-informed roadmaps capture that learning and turn it into institutional knowledge. Your next bet gets informed by your last hundred bets. Your estimates get sharper. Your hit rate improves.
This isn't about building financial models or complex attribution systems. It's about creating feedback loops between what you build and what customers actually pay for. Knowing whether that enterprise feature really unlocked enterprise customers or just made existing customers slightly happier. Surfacing which bets actually drive growth versus which ones just feel important.
The mechanical parts — tracking tickets, calculating ARR, preventing gaming — they're just tools. The real value is building an organization that makes increasingly intelligent bets about what to build next.
Some teams get so good at this that they can predict revenue impact within 20% consistently. They know which types of features drive expansion versus retention. They know which stakeholder estimates to trust for which kinds of bets. They've turned product development from educated guessing into calibrated prediction.
That's not perfection — 20% variance is still significant. But it's the difference between flying blind and flying with instruments. And in competitive markets, that difference determines who builds the right things fast enough to win.
Ready to elevate your product management?
Join 2,000+ product teams using Itemyly to accelerate delivery, improve alignment, and build better products.