


Last quarter I watched a product team celebrate shipping 47 features while their core platform lost 12% of enterprise customers to reliability issues. Their prioritization framework scored everything correctly — customer requests got points, strategic initiatives got weights, engineering estimates got refined. The math worked. The business didn't.
This pattern shows up everywhere. Teams build elaborate scoring systems that somehow miss the work that actually moves metrics. They ship feature after feature while retention bleeds, tackle low-effort wins while transformational bets sit untouched for quarters.
The problem isn't that teams don't prioritize. It's that most prioritization systems optimize for activity instead of outcomes, consensus instead of conviction, and safety instead of strategic bets.
After building prioritization systems across dozens of product organizations, the same structural failures keep tanking roadmaps. The fix isn't another framework — it's an organizational architecture that combines outcome tracking, evidence requirements, effort estimation, and risk assessment with clear governance rules and escalation paths.
Why standard prioritization breaks at the organizational level
Most prioritization happens in isolation. Product managers score initiatives in spreadsheets. Engineering estimates effort in story points. Leadership reviews roadmaps quarterly. Customer success escalates issues through support channels. Each group optimizes their slice without seeing the whole picture.
A fintech startup I worked with had three teams independently prioritizing payment improvements. Growth wanted faster checkout. Platform wanted better fraud detection. Customer success wanted clearer transaction histories. Each initiative scored high in their respective backlogs. Nobody realized they were essentially building three versions of the same underlying payment service upgrade.
The fragmentation gets worse as organizations grow. What starts as a simple backlog becomes multiple backlogs across multiple teams with different scoring criteria, different stakeholders, and different definitions of success. A "high priority" feature for the mobile team might directly conflict with the API team's stability goals. A customer request that sales marks as critical might undermine the product strategy leadership approved last quarter.
Traditional frameworks like RICE or Value vs. Effort matrices assume you can objectively score initiatives in isolation. But real product decisions involve trade-offs between competing goods. Should you fix the bug affecting 2% of power users or ship the feature that might unlock a new market segment? Should you invest in platform stability or push for the competitive differentiator? No scoring formula captures that context.
Even when teams try to align, they usually align on process instead of outcomes. They standardize templates, agree on scoring rubrics, sync on ceremonies. But they still end up with roadmaps full of safe, incremental improvements while the big bets that could actually transform the business never quite make it above the line.
The four pillars that actually drive prioritization decisions
Effective prioritization at the organizational level requires four interconnected evaluation pillars that most teams handle separately or ignore entirely.
Eliminate product chaos and align your team.
Itemyly helps you plan, prioritize, and track every product milestone seamlessly.
- Centralized roadmap management
- Stakeholder collaboration
- Release tracking & analytics
No credit card required
Outcome Definition and Measurement
Every initiative needs a clear outcome hypothesis — not "improve user experience" but "reduce checkout abandonment from 34% to 28% by eliminating the manual address validation step." This sounds obvious, but I've reviewed hundreds of roadmaps where half the initiatives have no measurable outcome attached.
The measurement piece is where things fall apart. Teams propose outcomes they can't actually measure, pick proxy metrics that don't connect to business value, or set targets without baselines. A marketplace app spent six months building advanced search filters to "improve discovery" without first measuring how current search behavior affected purchase rates.
You need three levels of outcome tracking:
-
Leading indicators you can measure during development (prototype engagement, design testing scores)
-
Launch metrics you can track immediately (adoption rate, feature usage)
-
Business outcomes you can validate over time (retention impact, revenue contribution)
Without all three, you're flying blind until it's too late to course-correct.
Evidence Requirements and Validation
Most bad prioritization decisions come from weak evidence. A single customer complaint becomes a "critical issue." An executive's hypothesis becomes a "strategic imperative." A competitor's feature becomes a "market requirement."
Strong prioritization requires graduated evidence thresholds. A small usability fix might only need a handful of user reports. A major platform investment needs quantitative data, qualitative research, and competitive analysis. The bigger the bet, the stronger the evidence required.
Here's what evidence graduation looks like in practice:
Small bets (under 2 sprints):
-
5+ consistent user reports OR
-
Clear bug with reproduction steps OR
-
Obvious improvement with minimal risk
Medium bets (2-8 sprints):
-
Quantitative data showing problem scope
-
Qualitative research validating root cause
-
Solution validation through prototypes or experiments
-
Clear success metrics defined
Large bets (8+ sprints):
-
Multiple evidence sources confirming opportunity
-
Validated customer willingness to pay/adopt
-
Competitive analysis showing differentiation
-
Technical feasibility assessment completed
-
Business case with ROI projection
The key is making evidence requirements explicit and non-negotiable. No more "the CEO wants this" as justification for a six-month investment.
Effort Estimation Beyond Story Points
Engineering teams love story points. Product teams hate them. Both are right. Story points work great for sprint planning but tell you nothing about actual delivery time, opportunity cost, or resource allocation.
Real effort estimation needs multiple dimensions:
-
Engineering weeks (not points)
-
Design and research time
-
Cross-team dependencies
-
Migration and rollout effort
-
Ongoing maintenance burden
A payment processor learned this the hard way. Their "2-sprint" feature to add cryptocurrency support turned into a 6-month initiative once they factored in compliance reviews, partner integrations, fraud system updates, and support training. The story points were accurate. The total effort was roughly 5x higher.
Smart teams estimate effort scenarios, not single numbers. Best case, likely case, worst case. They identify what could expand scope — regulatory requirements, technical debt, third-party dependencies. They price in coordination overhead for cross-team work.
Risk Assessment and Mitigation
Every prioritization discussion focuses on upside. Most teams don't systematically evaluate what could go wrong until something actually does.
Risk comes in multiple flavors:
-
Technical risk (will it work?)
-
Adoption risk (will users want it?)
-
Execution risk (can we build it well?)
-
Strategic risk (does it lock us into a direction?)
-
Operational risk (can we support it at scale?)
A social platform shipped a new content recommendation algorithm that improved engagement 15% in testing. They hadn't assessed operational risk. The algorithm required 3x more compute resources, crashed during peak traffic, and had to be rolled back after burning around $200k in infrastructure costs.
Risk assessment isn't about avoiding all risk — it's about understanding what you're signing up for. High-risk, high-reward bets can be good investments if you have mitigation plans and containment strategies.
Building the organizational architecture
Individual frameworks fail because they exist in isolation. You need an organizational architecture that connects prioritization decisions across teams, levels, and time horizons.
Governance Structure and Decision Rights
Clear decision rights prevent both bottlenecks and chaos. Most organizations either centralize everything (creating bottlenecks) or decentralize everything (creating conflicts).
The solution is graduated decision authority based on investment size and strategic impact:
Team-level authority (under 2 sprints, single team):
-
Bug fixes and small improvements
-
Technical debt within module boundaries
-
Customer-reported issues with clear scope
Product leadership authority (2-8 sprints, 1-2 teams):
-
New features within existing products
-
Moderate technical investments
-
Cross-team dependencies with clear boundaries
Executive authority (8+ sprints, multiple teams):
-
New product lines or major pivots
-
Platform-level technical changes
-
Initiatives affecting multiple customer segments
The boundaries need to be explicit and documented. Teams should know exactly when they need approval and from whom. No more informal escalations or surprise vetoes.
Escalation Rules and Override Mechanisms
Sometimes priorities need to change fast — a security vulnerability, a major customer threat, a competitive announcement. Your system needs clear escalation paths that don't require six meetings to invoke.
Effective escalation rules include:
-
Specific triggers (customer impact thresholds, revenue at risk)
-
Clear escalation paths (who to notify, in what order)
-
Override authority (who can reprioritize without committee approval)
-
Documentation requirements (what must be recorded when priorities change)
A B2B SaaS company formalized their escalation triggers: any issue affecting 5%+ of monthly recurring revenue could bypass normal prioritization. This stopped the endless debates about whether something was "really critical" — if it hit the threshold, it jumped the queue.
Scoring System and Calibration
Numbers create false precision. A feature scored 87 versus one scored 83 — is that difference meaningful? Usually not. But teams need some systematic way to compare options.
Here's an approach that actually works:
| Dimension | Score | Criteria |
|---|---|---|
| Outcome | 0 | No clear outcome |
| Outcome | 1 | Improves experience, hard to measure impact |
| Outcome | 2 | Measurable improvement to secondary metric |
| Outcome | 3 | Direct impact on primary business metric |
| Evidence | 0 | Hypothesis or single anecdote |
| Evidence | 1 | Multiple qualitative signals |
| Evidence | 2 | Quantitative data supporting opportunity |
| Evidence | 3 | Multiple evidence types with validation |
| Effort (inverse) | 0 | 6+ months or undefined |
| Effort (inverse) | 1 | 3-6 months |
| Effort (inverse) | 2 | 1-3 months |
| Effort (inverse) | 3 | Under 1 month |
| Risk (inverse) | 0 | High risk, no mitigation |
| Risk (inverse) | 1 | High risk with mitigation plan |
| Risk (inverse) | 2 | Moderate risk, well understood |
| Risk (inverse) | 3 | Low risk, proven approach |
Total score = Outcome × Evidence × (Effort + Risk)
This gives you a 0-36 range with natural clustering. Anything under 10 needs more work. 10-20 is solid but not urgent. 20+ deserves immediate attention.
Scores are just inputs though. The governance structure decides how to interpret them.
Integration Points and Feedback Loops
Prioritization without feedback is just gambling with better documentation. You need systematic ways to validate whether your bets paid off.
Quarterly business reviews aren't enough. By the time you realize an initiative failed, you've already started three more based on the same flawed assumptions.
Build feedback loops at multiple cadences:
-
Weekly
Early indicators from launched features
-
Monthly
Adoption and usage trends
-
Quarterly
Business outcome validation
-
Annually
Strategic bet assessment
More importantly, create mechanisms to feed lessons back into prioritization. If that "critical" enterprise feature only got adopted by 12% of target customers, update your evidence requirements. If the "simple" platform upgrade took 3x longer than estimated, adjust your effort calculations.
A simple visual of the organizational architecture workflow:
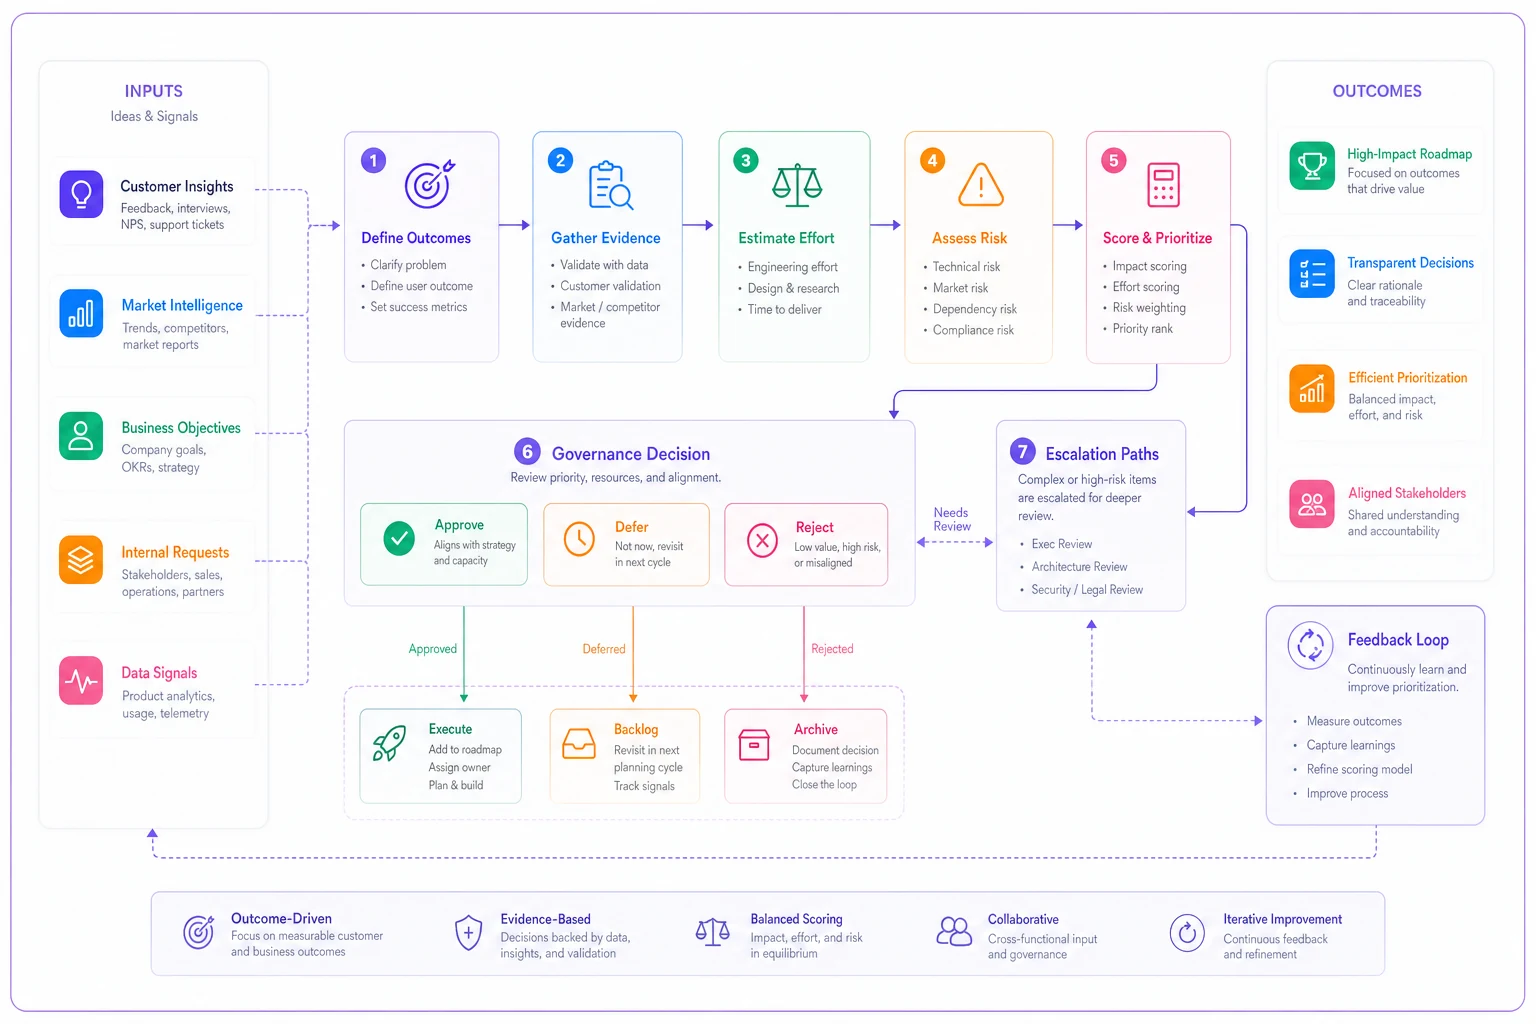
This diagram shows the flow from defining outcomes to scoring and governance, then back through feedback loops to inform future decisions.
Three real prioritization bets with scored examples
Here's how this architecture handles real prioritization decisions. These examples come from actual product organizations, with some details adjusted for clarity.
Bet 1: Platform modernization vs. feature velocity (E-commerce)
An online marketplace faced a classic dilemma. Their monolithic architecture was slowing feature development, but rebuilding would freeze the roadmap for months.
Outcome Definition:
Option A (keep building features): Ship 8-10 customer-requested features per quarter Option B (modernize platform): Reduce feature development time by 40% after a 6-month investment
Evidence Gathered:
-
Feature velocity had dropped 30% year-over-year as the codebase grew
-
Developer survey showed 60% of time spent on workarounds
-
Competitor analysis showed 3x faster feature delivery with modern architecture
-
Customer interviews revealed feature gaps weren't the primary churn driver
Effort Assessment:
-
Option A
2-3 engineers per feature, ongoing
-
Option B
8 engineers for 6 months, then reduced team size needed
Risk Analysis:
-
Option A
Continued velocity decline, developer retention issues
-
Option B
Feature freeze might lose competitive position, migration complexity
Scoring:
Option A: Outcome (2) × Evidence (2) × (Effort (2) + Risk (1)) = 12 Option B: Outcome (3) × Evidence (3) × (Effort (1) + Risk (2)) = 27
Governance Decision:
Despite the feature freeze risk, the executive team approved platform modernization with two conditions: maintain a small team for critical fixes, and deliver the migration in phases to show progress.
Result: Platform modernization completed in 7 months (slightly over). Feature velocity increased 52% in following quarters. The phased approach maintained customer confidence despite the temporary feature freeze.
Bet 2: Consumer app pivot vs. incremental improvements (Social)
A social app with declining engagement debated between doubling down on core features or pivoting to a new content format trending with younger users.
Outcome Definition:
Option A (improve core): Increase daily active users by 20% through better notifications and discovery Option B (pivot to new format): Capture 5% market share in a growing segment within 12 months
Evidence Gathered:
-
User research showed core features had fundamental engagement limits
-
Prototype of new format got 3x higher engagement in testing
-
Market analysis showed the new segment growing 200% annually
-
Current user base aging out of target demographic
Effort Assessment:
-
Option A
4 engineers for 3 months, incremental rollout
-
Option B
10 engineers for 4 months, plus marketing investment
Risk Analysis:
-
Option A
Might only delay inevitable decline
-
Option B
Could alienate existing users, unproven monetization
Scoring:
Option A: Outcome (1) × Evidence (2) × (Effort (2) + Risk (2)) = 8 Option B: Outcome (3) × Evidence (2) × (Effort (1) + Risk (1)) = 12
Governance Decision:
Product leadership chose a hybrid approach — small team on core improvements while the majority pivoted to the new format. This violated the "focus" principle but was meant to manage risk.
Result: The hybrid approach failed. Core improvements showed minimal impact. The new format launched late and underperformed. Clear lesson: half-measures in strategic pivots rarely work.
Bet 3: Enterprise security feature vs. SMB scalability (B2B SaaS)
A project management tool had two major opportunities: add enterprise security features to move upmarket, or improve scalability for their growing SMB customer base.
Outcome Definition:
Option A (enterprise security): Close 20 enterprise deals worth $2M annual recurring revenue Option B (SMB scalability): Support 10x user growth without performance degradation
Evidence Gathered:
-
Sales had 30 enterprise prospects blocked on security requirements
-
Current infrastructure showing strain at 50k concurrent users
-
Enterprise deals would require 6-9 month sales cycles
-
SMB growth rate at 15% monthly, hitting limits in 4 months
Effort Assessment:
-
Option A
6 engineers for 4 months plus ongoing compliance work
-
Option B
8 engineers for 3 months, mostly backend work
Risk Analysis:
-
Option A
Long sales cycles, enterprise support burden
-
Option B
Growth might slow naturally, over-investing in capacity
Scoring:
Option A: Outcome (3) × Evidence (3) × (Effort (1) + Risk (1)) = 18 Option B: Outcome (2) × Evidence (3) × (Effort (2) + Risk (2)) = 24
Governance Decision:
Despite the lower score for the enterprise option, the CEO overrode the recommendation based on a strategic goal to move upmarket. Escalation rules allowed this with documented reasoning.
Result: Enterprise security shipped on schedule. Closed 12 deals in the first year (below target, but still $1.2M ARR). Meanwhile, performance issues caused 8% churn in the SMB segment. The override decision was probably wrong in hindsight, but the governance system worked as designed.
Common failure patterns and prevention
Even with strong architecture, certain patterns consistently break prioritization.
The Executive Pet Project
Every organization has them — initiatives that exist because someone senior wants them, evidence be damned. The architecture doesn't eliminate these, but it makes them visible. When an executive overrides the scoring system, it gets documented. When pet projects fail, there's a clear trail showing why they were approved despite weak evidence.
Prevention: Require executives to use the same evidence standards, just with override authority. Make overrides public to the product organization. Track success rates of override decisions separately.
The Customer Hostage Situation
"If we don't build this, MegaCorp will leave." This threat hijacks roadmaps constantly. Sometimes it's real. Usually it's not. Sales teams naturally amplify customer demands, and without systematic evidence gathering, every request becomes existential.
Prevention: Create clear revenue threshold triggers. If a customer represents 10%+ of revenue, their requests get expedited review — not automatic approval. Below that threshold, requests go through normal prioritization. Track how often threatened churn actually happens.
The Shiny Object Pivot
A competitor launches something. A new technology emerges. An article goes viral. Suddenly everything on the roadmap looks outdated. Teams scramble to respond, abandoning half-finished initiatives for the next thing.
Prevention: Build "strategy lock" periods. For 6-8 weeks after committing to a major bet, no pivots allowed unless escalation triggers are hit. This forces teams to live with decisions long enough to get real feedback.
The Analysis Paralysis Trap
Some teams respond to prioritization architecture by over-analyzing everything. Six weeks of research for a two-week feature. Perfect data that arrives too late. The cure becomes worse than the disease.
Prevention: Set evidence gathering time boxes. Small bets get 1 week max. Medium bets get 2-4 weeks. Large bets get 4-8 weeks. When time's up, decide with what you have or explicitly choose to defer.
Implementing without grinding to a halt
Rolling out organizational prioritization architecture sounds like a six-month change management nightmare. It doesn't have to be.
Start with one team and one quarter. Pick a team that's struggling with prioritization but open to change. Have them run the full architecture for their next quarterly planning cycle:
-
Define outcomes for every initiative
-
Gather evidence with clear thresholds
-
Estimate effort in weeks, not points
-
Assess risks explicitly
-
Score everything using the simple formula
-
Document override decisions
Don't try to perfect it. The first quarter is about building muscle memory, not optimization. You'll learn which evidence types actually predict success, which effort estimates consistently miss, and which risks materialize most often.
After one quarter, expand to adjacent teams. Share the lessons from the pilot team, adjust the scoring weights based on what you learned, and add governance rules for cross-team dependencies.
By quarter three, you can roll out organization-wide with confidence. You have real examples, refined processes, and proof that it works.
The biggest implementation risk is automating too early. Teams love to build elaborate tools before proving the process works. Resist this. Spreadsheets and documents work fine for the first year. Only build software once you know exactly what you're automating.
That said, this is where AI-powered operational software becomes genuinely useful — not for making prioritization decisions, but for tracking the volume of context that good prioritization actually requires. Evidence gathering across customer channels, effort tracking across teams, outcome measurement across systems. The right platform can surface patterns that are hard to see manually: which types of evidence actually predict success, which estimates consistently run over, which risks show up most often. It turns prioritization from a quarterly planning exercise into something closer to a continuous learning system.
When the highest-scored items still aren't the right choice
Sometimes your prioritization system will clearly indicate one path, and you should still choose another.
The system isn't meant to make decisions for you. It's meant to make trade-offs visible, evidence explicit, and overrides accountable. When you choose the lower-scored option, you should know exactly why and what you're risking.
Maybe you're placing a strategic bet on a new market despite weak evidence. Maybe you're fixing a low-impact bug because it affects your most vocal advocates. Maybe you're building a feature that scores poorly but unlocks a partnership worth 10x its direct value.
These decisions aren't failures of the prioritization system — they're exactly what it's designed to surface. By making the default path clear, you can consciously choose to deviate with full understanding of the trade-off.
The architecture succeeds when these overrides become rare, intentional, and educational. When you override and fail, you learn something about your market or strategy. When you override and succeed, you learn something about what your scoring system might be missing.
The real measure of prioritization success
Most teams measure prioritization success by velocity — how much got shipped. Or by accuracy — whether estimates matched reality. Both miss the point.
Real prioritization success shows up in what doesn't happen:
-
You don't have three teams building overlapping solutions
-
You don't chase every competitor feature announcement
-
You don't abandon initiatives halfway through without learning anything
-
You don't have surprise vetoes after months of work
-
You don't lose critical customers while shipping unused features
And more importantly, what does happen:
-
The big bets that could transform your business actually get resourced
-
Teams can explain why they're working on what they're working on
-
Failed initiatives generate learnings that improve future decisions
-
Strategic alignment survives contact with quarterly planning
A transportation platform implemented this architecture about eighteen months ago. They haven't gotten faster at shipping. Their estimates aren't more accurate. But revenue per developer hour has increased significantly because they're building the right things instead of just building things right.
That's what prioritization is actually for — not to optimize activity, but to optimize outcomes. The architecture just makes it possible to do that systematically and repeatedly.
The best prioritization system isn't the one with the most sophisticated scoring algorithm or the prettiest roadmap visualization. It's the one that consistently surfaces the work that matters, makes trade-offs transparent, and turns every decision into a learning opportunity for the next one.
Most teams already have the information they need to make great prioritization decisions — they just need an organizational architecture that connects that information to actual decisions in a repeatable way.
Ready to elevate your product management?
Join 2,000+ product teams using Itemyly to accelerate delivery, improve alignment, and build better products.