

Multi-product portfolios rarely fail because of bad ideas. They fail because everyone quietly assumes there's more capacity than there is. Product A's PM thinks she has "most of two squads." Product B's lead thinks he has "at least one and a half." The platform team thinks it's building for everyone and belongs to no one. Then Q3 arrives, three launches slip in the same two weeks, and leadership asks why "everything is late" when on paper the roadmap looked balanced.
That's the core problem with product portfolio capacity planning: the arithmetic is almost never done honestly across products. Each roadmap is planned in isolation, then bolted onto a shared engineering org that can't actually deliver the sum of what was promised. This post walks through a template-driven model — investment bands, capacity tied to real velocity, what-if scenario tables, and explicit kill/hold/accelerate criteria — that makes the tradeoffs visible before they turn into missed dates.
The real bottleneck isn't prioritization — it's the missing capacity ledger
Most teams think their portfolio problem is prioritization. They buy another scoring framework, run another workshop, produce a ranked list. But a ranked list assumes you know how much you can spend. What actually breaks is the capacity ledger — the shared, honest accounting of engineering weeks available versus committed across every product line.
In a lot of multi-product orgs, capacity gets counted three or four times. A single senior backend engineer is "allocated" to Product A's payments work, "available" for platform hardening, and "on call" for Product C's integration. Three roadmaps each assumed they had him. None of them are wrong on paper. All three will be surprised.
A typical example: a company with roughly 40 engineers spread across five products builds annual plans where each product line commits to its ambitious version. Add up the committed work and it needs the equivalent of about 58 engineers. Nobody notices, because no single planning document ever shows all five demands against the one shared supply. The gap only becomes real when delivery starts slipping — and by then it reads as an execution failure instead of a planning one.
The insight here is blunt: portfolio planning breaks at the accounting layer, not the strategy layer. If you can't produce one number for total available capacity and one number for total committed capacity, no prioritization framework will save you.
Investment bands: stop planning at the feature level
The first fix is to stop allocating capacity feature by feature. At the portfolio level, that's too granular and too easy to game. Allocate in investment bands instead — coarse buckets of where the org's engineering weeks go before anyone argues about individual epics.
Eliminate product chaos and align your team.
Itemyly helps you plan, prioritize, and track every product milestone seamlessly.
- Centralized roadmap management
- Stakeholder collaboration
- Release tracking & analytics
No credit card required
| Investment band | What it funds | Typical portfolio share | Who defends it |
|---|---|---|---|
| Growth bets | New product/market expansion, big feature swings | 30–40% | Product leadership |
| Core evolution | Improvements to existing revenue-generating products | 25–35% | Individual PMs |
| Reliability & debt | Platform hardening, tech-debt retirement, migrations | 15–25% | Eng leadership |
| Compliance & risk | Regulatory, security, contractual obligations | 5–15% | Legal/security |
| Buffer | Unplanned urgent work, estimate overrun | 10–15% | Nobody (that's the point) |
The bands do something political frameworks usually avoid: they force a fight about the shape of investment before anyone falls in love with a specific feature. When Growth is capped at 35% of capacity, every product line competing for growth capacity has to trade against the others — not against the reliability budget.
The mistake most teams make is skipping the buffer band, or setting it to zero because "we'll be disciplined this quarter." You won't. Urgent work always arrives. If the reliability and debt band gets consistently starved, you'll pay for it later — this is the same dynamic that makes technical debt derail delivery when maintenance keeps losing to features quarter after quarter. Bands make that starvation visible instead of accidental.
When investment bands make sense
-
You have three or more product lines competing for shared engineering
-
Leadership keeps re-litigating priorities mid-quarter
-
Reliability and debt work consistently gets crushed by feature pressure
When they're overkill
If you're running one product with two squads, bands are bureaucratic overhead. You don't need a portfolio model to manage a portfolio of one. Just do capacity forecasting at the team level and move on.
Tie capacity to actual velocity, not headcount
Almost every planning cycle falls into the same trap: capacity gets calculated from headcount. "We have 40 engineers, 48 working weeks, so we have about 1,900 engineer-weeks a year." That number is fiction, and planning against it guarantees over-commitment.
-
Start with raw engineer-weeks. 40 engineers × ~46 working weeks ≈ 1,840.
-
Subtract non-delivery load. On-call, interviews, support rotations, meetings — realistically 20–30%. Drop to roughly 1,300–1,470.
-
Apply a velocity reality factor. Look at what the org actually shipped last two quarters versus what it planned. Most teams land somewhere around 60–75% of planned throughput.
-
Reserve the buffer band. Pull out the 10–15% for urgent and overrun.
-
What's left is your commitable capacity. For this example org, probably closer to 1,000–1,100 effective engineer-weeks — not 1,900.
The difference between headcount-based capacity and velocity-based capacity is often 40% or more. Teams that plan against the top number and deliver against the bottom number will always look like they're underperforming, when really they were over-promised from day one.
Track velocity by product line, not just org-wide, to avoid cross-product over-allocation.
Velocity should be measured per product line too, because velocities differ wildly. A mature product with a stable codebase might convert planned work to shipped work at 80%. A brand-new product still finding its architecture might run at 45%. If you allocate capacity to the new product using the mature product's velocity, you've quietly guaranteed its roadmap will slip.
What-if scenario tables: make the tradeoff visible before the argument
Once you have honest bands and honest velocity, the portfolio conversation shifts from "what do we want?" to "what fits?" Scenario tables earn their keep here. Instead of one roadmap, you build two or three fully-costed capacity scenarios and lay them side by side.
A simplified what-if table for a portfolio quarter might look like this:
| Scenario | Growth band | Core band | Reliability band | What ships | What slips |
|---|---|---|---|---|---|
| A: Growth-heavy | 45% | 25% | 10% | Product B expansion, Product A revamp | Platform migration, debt paydown |
| B: Balanced | 35% | 30% | 20% | Product B expansion (phase 1), core fixes | Product A revamp → Q4 |
| C: Stabilize | 25% | 30% | 30% | Reliability work, small core wins | Product B expansion delayed |
The value isn't the table itself — it's forcing leadership to pick a row. When you show that Scenario A ships the growth work but knowingly defers the platform migration, the deferral becomes a decision instead of a surprise. Six weeks later, when the migration hasn't happened, nobody gets to act betrayed. They chose Scenario A.
One thing worth noting about these conversations: the moment you show scenarios instead of a single plan, the loudest voice in the room stops winning by default. It's much harder to demand "just add my thing" when the table plainly shows what your thing displaces.
Scenario tables also surface hidden coupling. A growth-heavy row that defers platform work often quietly breaks other product lines that depend on that platform. This is exactly why ignoring roadmap dependencies costs launches — the scenario that looks cheapest in isolation is frequently the one that detonates a dependency two products over.
Transparent kill / hold / accelerate criteria
Portfolios don't just fail from over-commitment. They fail from never stopping anything. Products get funded once and then coast on inertia for years, consuming capacity that newer bets can't touch. If you never kill or pause anything, your growth band is a lie — it's already spent on last year's decisions.
The fix is publishing the criteria before the emotional attachment forms. Every product or major initiative in the portfolio gets a lightweight scorecard reviewed each quarter, with pre-agreed thresholds.
A runnable set of criteria:
-
Accelerate if
revenue or adoption is beating plan by ~20%+, and the constraint to growth is purely capacity. Move it up a band.
-
Hold if
metrics are flat but not declining, dependencies are blocking, or a decision is pending. Freeze new investment, keep it running.
-
Kill if
it's missed its primary success metric two review cycles in a row with no credible turnaround, or its opportunity cost against a waiting bet is clearly higher.
The important part isn't the exact thresholds — it's that they're written down and applied the same way to every initiative, including the executive's pet project. Teams have kill criteria on paper but never actually kill anything, because each individual case gets an exception. "Just one more quarter" applied to five products is how a portfolio ossifies.
A concrete governance ritual that works: a quarterly portfolio review where each product owner presents their scorecard against the published thresholds, and the default action is whatever the criteria dictate. Overriding the default is allowed — but the override, and the reason, gets recorded. That record matters. Three quarters later, when the "one more quarter" product still hasn't turned around, you have the paper trail showing exactly how many exceptions it got.
Who should NOT run heavy kill/hold/accelerate governance
Early-stage teams still searching for product-market fit. If you're pivoting every few months, formal quarterly kill criteria just add ceremony to chaos. This model is for portfolios with enough maturity that inertia — not indecision — is the real enemy.
A real scenario: five products, one starving platform
A mid-sized B2B software company ran five products on a shared engineering group of around 35 people. Each product line planned independently. On paper, the roadmap looked ambitious but reasonable. In reality, three of the four quarterly launches slipped, and the platform team — which everyone depended on — never had capacity to finish a migration that had been "next quarter" for over a year.
When they finally did the honest accounting, the picture was ugly. Committed work summed to roughly 130% of velocity-adjusted capacity. The reliability band was effectively 6% — the platform team kept getting pulled into product firefights. And no product had been killed or paused in about two years, so the entire growth band was funding legacy commitments.
They didn't fix it with a new tool or more hires. They built the ledger, set bands (Growth 35%, Core 30%, Reliability 20%, Compliance 5%, Buffer 10%), and ran one quarterly review with real kill/hold criteria. In the first review they paused one underperforming product and moved its two engineers onto the platform migration. Two quarters later, launch predictability had gone from landing roughly half their committed dates to landing most work within its delivery band. The migration that had been stuck for over a year finally shipped.
The interesting part: nobody's velocity actually improved. They just stopped promising work that never fit.
Where tooling actually helps
You can run all of this in spreadsheets, and plenty of teams do. The friction shows up at scale — when band allocations, per-product velocity, scenario tables, and quarterly scorecards all live in separate documents that drift out of sync the moment anything changes. Someone updates a velocity number in one tab, three scenario tables silently go stale, and the portfolio review runs on numbers nobody trusts.
This is where operational software with AI automation earns its place — not as a magic planner, but as the thing keeping the capacity ledger honest. Pulling actual throughput from your delivery system to update velocity automatically, flagging when committed work crosses available capacity, surfacing which scenario a mid-quarter change just broke. The judgment stays with the humans. The tedious reconciliation — the part that quietly rots in spreadsheets — is what's worth automating. When your bands, velocity, and scenarios update from real delivery data instead of manual copy-paste, the portfolio review stops being an archaeology project.
Bringing it together
The reason product portfolio capacity planning blocks launches is almost never a shortage of good ideas or even a shortage of engineers. It's that the org plans each product against imaginary capacity, never reconciles the total, and never stops anything. Investment bands force an honest conversation about the shape of spend. Velocity-tied capacity replaces the headcount fiction with what the org actually ships. Scenario tables turn tradeoffs into recorded decisions. And transparent kill/hold/accelerate criteria stop yesterday's bets from strangling tomorrow's.
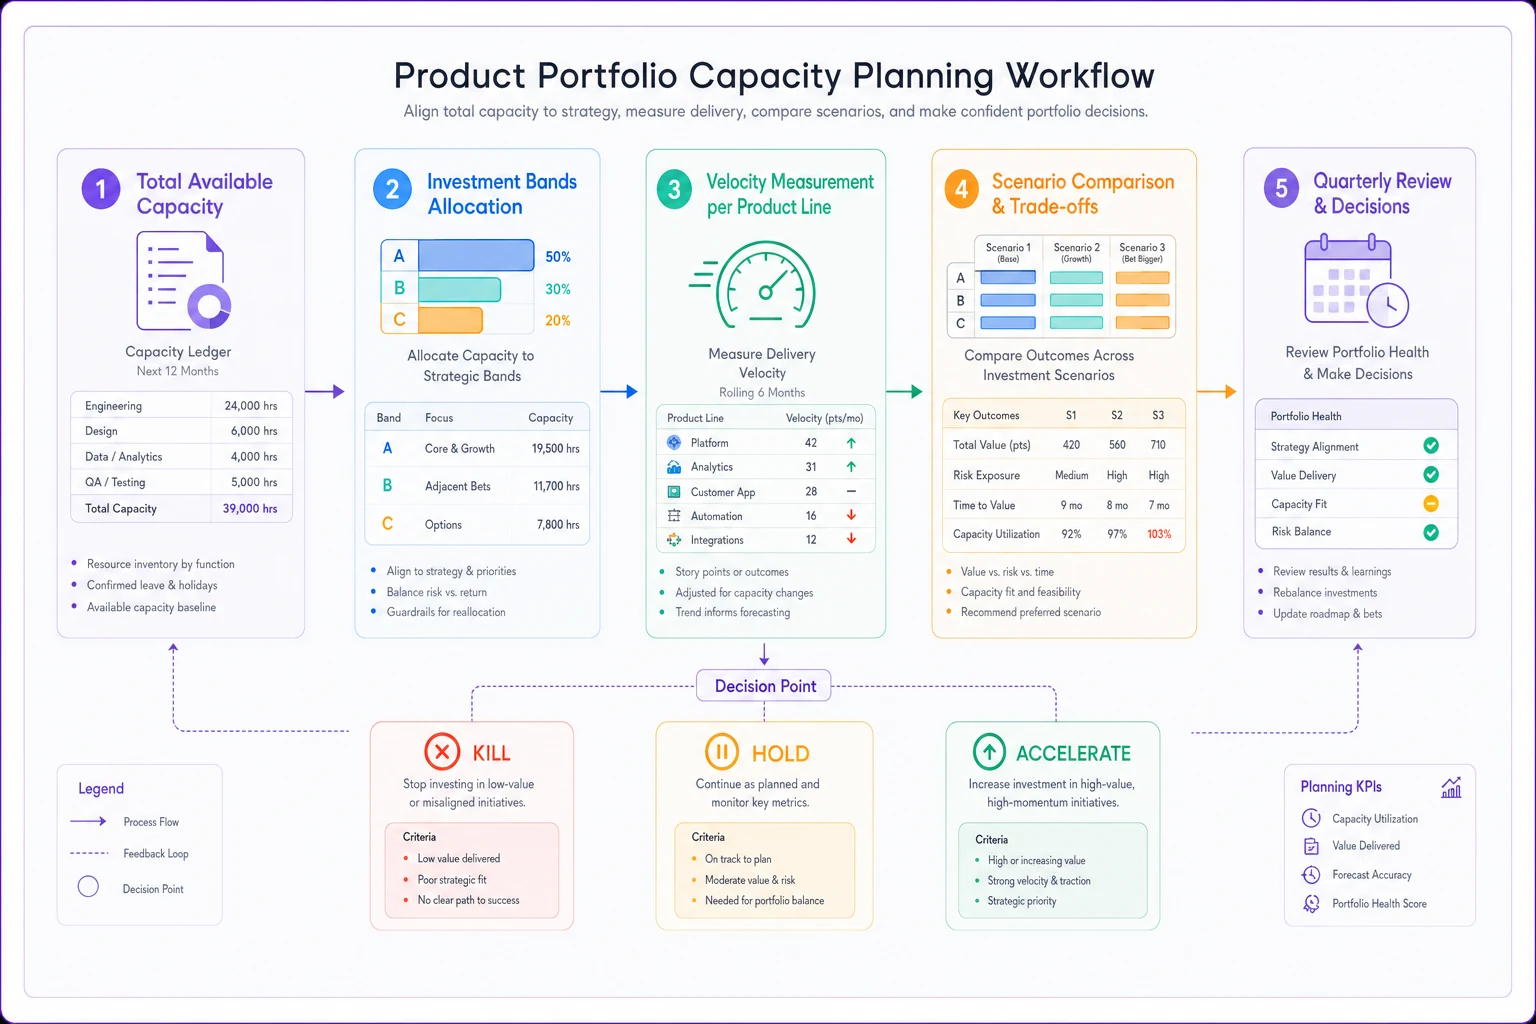
A simple visual that follows ledger → bands → velocity → scenarios → review helps keep the process clear in meetings.
Start with the ledger. If you can't put total available capacity and total committed capacity on one page and show they roughly match, none of the fancier machinery matters yet. Get those two numbers honest, and half your "execution problems" turn out to have been planning problems the whole time.
Ready to elevate your product management?
Join 2,000+ product teams using Itemyly to accelerate delivery, improve alignment, and build better products.