

Technical debt kills product teams slowly. Not through dramatic failures, but through a thousand small cuts. Every sprint gets harder. Every feature takes longer. Every estimate becomes a guess.
The worst part? Most teams know exactly where the debt lives. They just can't get anyone to prioritize it over the next feature. Product managers push features. Engineers push rewrites. Nobody wins.
Teams that actually survive technical debt have specific systems for making it visible, measurable, and hard to ignore. Not vague "20% time for debt" rules that never stick. Real scoring models. Visual heatmaps. Governance that holds.
The compound effect nobody tracks
Technical debt compounds faster than credit card interest. A shortcut taken six months ago now blocks three features. A database design that "worked fine" at 1,000 users melts at 10,000. That authentication system everyone avoids touching? It's blocking your entire mobile roadmap.
Most product teams track velocity religiously. Feature completion rates. Sprint burndown. Release cadence. But nobody tracks the inverse: how much slower are you getting each quarter?
What actually happens in most orgs looks something like this. Q1 velocity: 47 story points. Q2: 44. Q3: 38. Q4: 31. The team hasn't changed. The process hasn't changed. But every sprint produces less.
Engineering knows why. The payment processing module requires manual database updates for edge cases. The notification system can't handle batch operations so everything runs in loops. User permissions logic is scattered across fourteen services. Every new feature navigates that minefield.
Product managers see different symptoms. Customer complaints about performance. Features that should take two sprints stretching to four. Engineers padding estimates because they know they'll hit something unexpected. Release dates becoming suggestions.
The breaking point usually comes when a simple request reveals the house of cards. "Can we add a filter to the dashboard?" Sure — except the dashboard pulls from three unsynchronized data sources, the caching layer can't handle dynamic queries, and the frontend framework is so outdated that adding modern components requires a partial rewrite.
Why debt stays invisible until it's too late
Technical debt hides behind working features. The payment system processes payments. The authentication works. The API returns data. From the outside, everything functions. From the inside, it's held together with duct tape.
Eliminate product chaos and align your team.
Itemyly helps you plan, prioritize, and track every product milestone seamlessly.
- Centralized roadmap management
- Stakeholder collaboration
- Release tracking & analytics
No credit card required
Product managers don't see the debt directly. They see symptoms. Features take longer than expected. Bugs appear in unrelated areas after releases. Engineers seem frustrated but can't quite explain why that "simple change" needs three sprints.
The conversations follow a predictable pattern:
PM: "Why does adding a sort option take two sprints?" Engineer: "Because we need to refactor the data layer first." PM: "Can't we just add the sort without refactoring?" Engineer: "Technically yes, but it will make things worse." PM: "Let's do it the fast way now and fix it later."
Later never comes. The next feature request arrives. The quarterly goals don't include "fix old code." The debt grows.
Engineers try different things. They add "tech debt" tickets to the backlog that sit at the bottom forever. They negotiate for maintenance sprints that get cancelled when deadlines loom. They pad feature estimates to sneak in refactoring, which just makes them look slow.
Some teams try the "boy scout rule" — leave code better than you found it. But without clear guidelines, this creates inconsistency. One developer refactors aggressively, another does minimal changes, and suddenly the codebase has three different patterns for the same operation.
A scoring model that connects debt to delivery impact
Making technical debt visible means translating engineering pain into business impact. Not vague "this will slow us down" warnings, but specific measurable effects on delivery capacity.
Here's a scoring framework that works:
Frequency Impact (1-5 points)
-
How often does this debt affect development?
-
5 = Every sprint, multiple times
-
4 = Every sprint, at least once
-
3 = Every 2-3 sprints
-
2 = Monthly
-
1 = Rarely
Scope Creep Factor (1-5 points)
-
How much does this debt expand feature work?
-
5 = Doubles or triples estimate
-
4 = Adds 50-75% to estimate
-
3 = Adds 25-50% to estimate
-
2 = Adds 10-25% to estimate
-
1 = Minimal impact on estimates
Risk Multiplication (1-5 points)
-
How much does this debt increase bug risk?
-
5 = High probability of production incidents
-
4 = Regular bugs in related features
-
3 = Occasional unexpected behavior
-
2 = Minor edge cases
-
1 = No notable risk increase
Developer Friction (1-5 points)
-
How much does this slow down development?
-
5 = Requires senior developer involvement always
-
4 = Significant documentation/research needed
-
3 = Confusing but manageable
-
2 = Minor inconvenience
-
1 = No friction
Future Feature Block (1-5 points)
-
What features does this debt prevent?
-
5 = Blocks major roadmap items
-
4 = Blocks important features
-
3 = Limits feature options
-
2 = Complicates some features
-
1 = No blocking
Total score determines priority tier:
| Score Range | Priority Tier |
|---|---|
| 20-25 points | Critical (address immediately) |
| 15-19 points | High (address within quarter) |
| 10-14 points | Medium (address within 6 months) |
| 5-9 points | Low (address opportunistically) |
The key difference with this model: it focuses on delivery impact, not code quality. A messy module that nobody touches scores low. A small technical limitation that affects every feature scores high. That distinction matters more than most teams realize.
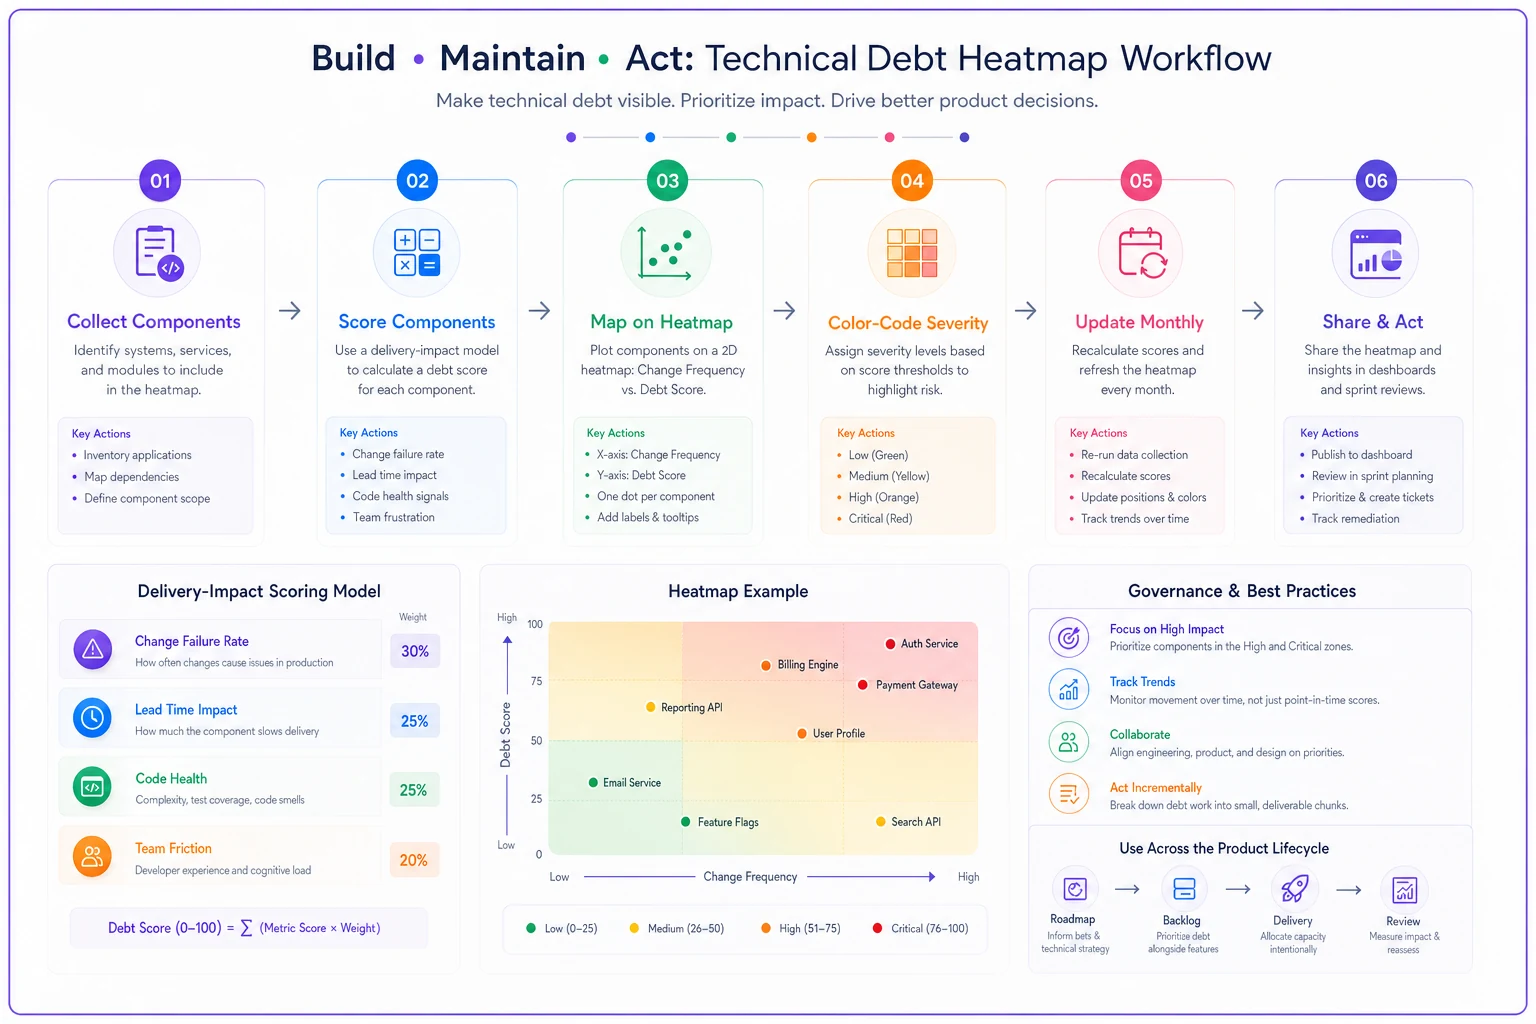
Building your debt heatmap visualization
Numbers alone don't drive action. Visual representation makes debt hard to ignore. A debt heatmap shows where problems concentrate and how they interconnect.
Start with your actual system architecture — not the idealized version from the wiki, but the real one. The authentication service that somehow handles user preferences. The reporting module that also manages data exports. The payment system that inexplicably contains business logic for subscriptions.
X-axis: Change Frequency
How often does this component get modified?
-
Weekly
-
Bi-weekly
-
Monthly
-
Quarterly
-
Rarely
Y-axis: Debt Score
Using the scoring model above, what's the total debt score for this component?
Color coding makes patterns obvious:
-
Red (20-25)
Critical debt in high-change areas
-
Orange (15-19)
Significant debt affecting regular work
-
Yellow (10-14)
Moderate debt worth monitoring
-
Green (0-9)
Acceptable technical state
The heatmap surfaces uncomfortable truths. That legacy billing system everyone avoids — if it's in the bottom-left (rarely changed, even with high debt), it might not be worth touching. But the user service that every feature runs through? If that's orange or red, it's dragging your velocity down.
Update the heatmap monthly. Track movement. A component shifting from green to yellow is an early warning sign. A component moving from rarely-changed to frequently-changed while carrying debt becomes a priority fast.
Some teams display this heatmap on a dashboard, in sprint reviews, in planning sessions. When everyone sees the same visualization, conversations shift from "should we fix this?" to "which red zone do we tackle first?"
Include the heatmap in sprint reviews so prioritization happens naturally during planning.
Here's a simple workflow for creating and updating this heatmap.
When everyone sees the same visualization, conversations shift from debating debt to deciding which red zone to address first.
Governance rules that actually get followed
Most technical debt governance fails because it relies on willpower. "We'll dedicate 20% of each sprint to debt." Two sprints later that's 10%. Then 5%. Then zero when the big deadline hits.
Effective governance embeds debt work into the development process so it's not a separate decision each sprint.
The Debt Tax Rule
Every feature that touches a red-zone component must include debt reduction in its scope — not as a separate ticket, but as part of the feature work itself.
Building a new user preference feature that touches the authentication service (debt score: 22)? The estimate includes refactoring the preference storage mechanism. This isn't optional. It's part of the definition of done.
This works because it doesn't require separate prioritization battles, it improves exactly the areas being worked on, and it can't be deprioritized without deprioritizing the feature itself.
The Complexity Budget
Each sprint has a complexity budget based on your debt score. For every 5 points of debt score in components you're modifying, reduce feature commitment by 10%.
Sprint planning with a 40-point velocity:
-
Features touch components with total debt score of 15
-
Complexity reduction
30% (15 ÷ 5 × 10%)
-
Adjusted capacity
28 points
This forces realistic planning. Teams can't pretend debt doesn't affect velocity when the numbers are right there in the sprint plan.
The Escalation Threshold
When a component's debt score exceeds 20, it triggers mandatory review before any new feature work in that area. Not a suggestion. A required checkpoint.
The review asks three questions:
-
Can we deliver the feature without making debt worse?
-
What's the minimum refactoring needed to proceed safely?
-
Should we pause feature work for focused debt reduction?
Sometimes the answer is proceed carefully. Sometimes it's allocating a full sprint to refactoring. The point is making the decision explicit rather than letting it happen by accident.
Sprint-level cadence that balances both
The sprint level is where theory meets reality. Here's how teams successfully balance feature delivery with debt reduction across different approaches.
The Alternating Focus Model
-
Sprint 1-2
Feature development with debt tax applied
-
Sprint 3
Debt reduction sprint focused on highest-scoring items
-
Sprint 4-5
Feature development with debt tax applied
-
Sprint 6
Debt reduction sprint
This works well for teams with predictable release cycles. Marketing knows features land in sprints 1-2 and 4-5. Engineering knows sprints 3 and 6 are for foundation work. Everyone plans around it.
One online education platform used this model after their aggregate debt score hit 87 across all components. Course creation features shipped in feature sprints. Video processing pipeline refactoring happened in debt sprints. After four months, velocity climbed from 31 to 44 points per sprint.
The Integrated Capacity Model
-
Every sprint allocates points explicitly
-
70% feature work (28 points from 40 total)
-
20% debt reduction (8 points)
-
10% bugs and maintenance (4 points)
The crucial part: debt work gets selected first, not last. At sprint planning, the team identifies the highest-impact debt items that fit in 8 points. Those go on the board first. Features fill the remaining capacity.
The Strike Team Model
Rotate one developer per sprint to focus entirely on debt reduction while the rest of the team delivers features. That developer takes no feature work, focuses on highest-scoring debt items, documents changes for the team, and rejoins feature work next sprint.
This works particularly well for teams of five to eight developers. Feature velocity drops by roughly 15%, but debt score decreases consistently. After six months, the improved codebase typically recovers that 15% and more.
Making the invisible visible
The real challenge with technical debt isn't fixing it. It's getting everyone to acknowledge it exists and affects delivery. Engineers know it's there. Product managers suspect something's wrong. Leadership wonders why velocity keeps dropping.
A scoring model makes debt measurable. Instead of "the payment system is a mess," you have "the payment system scores 23, costing roughly 8 story points per sprint." That's a business conversation, not a technical complaint.
The heatmap makes patterns undeniable. When five red components cluster around user management, everyone can see the problem zone. When previously green areas turn yellow, everyone sees the degradation. When refactoring turns a red zone green, everyone sees the improvement.
Governance rules remove the negotiation. The debt tax applies automatically. The complexity budget adjusts itself. The escalation threshold triggers at a set point. These aren't policies to be debated each sprint — they're operating procedures.
The sprint cadence makes execution predictable. Whether alternating focus, integrating capacity, or rotating strike teams, everyone knows when debt work happens. Product managers plan features around it. Engineers prepare refactoring plans. Leadership can see actual progress.
Tracking what actually matters
Most teams track the wrong metrics for technical debt. Lines of code. Test coverage. Cyclomatic complexity. These measure code quality, not delivery impact.
Track metrics that connect to velocity:
-
Estimate Accuracy Degradation Plot actual vs estimated story points over time. If estimates consistently run 30-40% over, debt is likely a major factor. After debt reduction, this gap should narrow.
-
Feature Cycle Time by Component Measure how long features take when they touch different components. Features touching high-debt areas take longer. This data directly supports your heatmap scoring.
-
Regression Rate by Area Count bugs introduced by new features, grouped by component. High-debt areas generate more regressions. This quantifies the risk multiplication score.
-
Developer Onboarding Time Track how long new developers take to make their first meaningful contribution to each component. High-debt areas take longer — this measures true complexity, not perceived complexity.
A practical example: one team tracked these metrics for their inventory management system (debt score: 21). Features averaged 180% of estimate. Regression rate hit 3.2 bugs per feature. New developer onboarding took around three weeks. After two focused debt sprints, features hit 110% of estimate, regression rate dropped to 0.8, and onboarding shortened to one week.
The compound returns of systematic debt reduction
Technical debt reduction isn't about clean code. It's about delivery capacity. Every point of debt score reduced returns story points to your velocity. Every red zone turned green unlocks features that were previously too risky to ship.
The math is straightforward. A team with 40-point velocity losing 30% to debt effectively delivers 28 points. Reduce that overhead to 10%, and you're delivering 36 points. That's roughly two extra features per sprint without adding developers or working weekends.
The real value compounds over time. Features that would have taken four sprints take two. Bugs that would have required hotfixes don't appear. New developers who would have needed months to contribute are productive in weeks.
Start with the scoring model. Even if you do nothing else, score your technical debt. Make it visible. Put numbers on the pain. Transform vague engineering complaints into specific delivery impacts.
Build the heatmap. Visual representation changes conversations. Instead of debating whether debt matters, you're discussing which red zone to address first.
Implement at least one governance rule. The debt tax is the easiest starting point. Pick your highest-debt component. The next feature that touches it includes refactoring. No exceptions.
Choose a sprint cadence that fits your team. Don't aim for perfection — aim for consistency. Even 10% of capacity applied consistently to debt reduction beats sporadic heroic refactoring efforts.
Technical debt isn't really a technical problem. It's a visibility and prioritization problem. Make it visible through scoring. Make it urgent through heatmaps. Make it systematic through governance. Make it sustainable through sprint cadence.
Your velocity will stop dropping. Your estimates will become reliable. Your developers will stop padding stories. Your features will ship when promised. Not because you wrote perfect code, but because you made technical debt as visible and manageable as feature work.
The best time to start was six months ago when velocity first started dropping. The second best time is your next sprint planning session.
Ready to elevate your product management?
Join 2,000+ product teams using Itemyly to accelerate delivery, improve alignment, and build better products.