
Most product teams commit to roadmaps using gut feelings about team velocity. They count epics, multiply by some historical average, add buffer time, then wonder why quarterly commitments slip by weeks or months.
The real problem isn't estimation accuracy. It's that teams treat capacity forecasting for roadmaps as a single-point prediction when it should be a probability distribution. The pattern shows up constantly across product organizations of all sizes: teams need a lightweight model that converts epic counts into delivery ranges with explicit uncertainty bands, not another sprint velocity calculation dressed up as a roadmap.
Why traditional velocity math breaks down for roadmap planning
Sprint velocity works reasonably well for near-term planning. You know your team delivers 40 story points per sprint, so you can predict the next 2-3 sprints with decent accuracy. Roadmap planning is a different animal entirely.
When you're looking at quarters or half-years out, several things compound on each other.
Your historical data comes from completed work, but upcoming epics have different characteristics. That enterprise integration epic isn't comparable to last quarter's UI refresh, even if both are labeled "large."
Dependencies multiply as you look further out. A single blocked epic can cascade delays across multiple quarters. Traditional velocity calculations assume independent work items, but roadmap epics are interconnected in ways that velocity math just doesn't capture.
Team composition shifts over longer horizons too. The velocity you measured with your current team won't hold when two senior engineers rotate to another project next quarter. New hires ramp slowly. Context switching increases as initiatives overlap.
And market conditions force scope changes mid-flight. That epic you sized at 8 stories in January becomes 15 stories by March when sales requests more features. Or shrinks to 3 stories when budget constraints hit.
The lightweight model: converting epics to delivery ranges
Instead of false precision, build a model that acknowledges uncertainty from the start.
Eliminate product chaos and align your team.
Itemyly helps you plan, prioritize, and track every product milestone seamlessly.
- Centralized roadmap management
- Stakeholder collaboration
- Release tracking & analytics
No credit card required
Begin with cycle time, not story points. Pull your last 20-30 completed epics. How many calendar days from "in progress" to "done"? Don't average them—plot them as a distribution. You'll almost always see clusters around certain durations.
-
Small epics
15-25 days (roughly 30% of epics)
-
Medium epics
35-55 days (roughly 50% of epics)
-
Large epics
70-120 days (roughly 20% of epics)
Notice those are ranges, not single numbers. A "medium" epic might take 35 days under ideal conditions or 55 days with typical friction.
Next, apply uncertainty multipliers based on horizon distance. Work starting next sprint has low uncertainty—multiply your cycle time range by 1.0-1.2. Work starting next quarter: multiply by 1.3-1.8. Work beyond six months: multiply by 1.8-2.5.
This produces bands, not points. That medium epic planned for Q3 shows a delivery range of 45-99 days (35-55 days × 1.3-1.8), not "8 weeks."
Start with three clusters (small, medium, large) — most teams' cycle times naturally align into these bands.
Here's a simple workflow visualization that shows the steps from raw cycle times to final delivery bands.
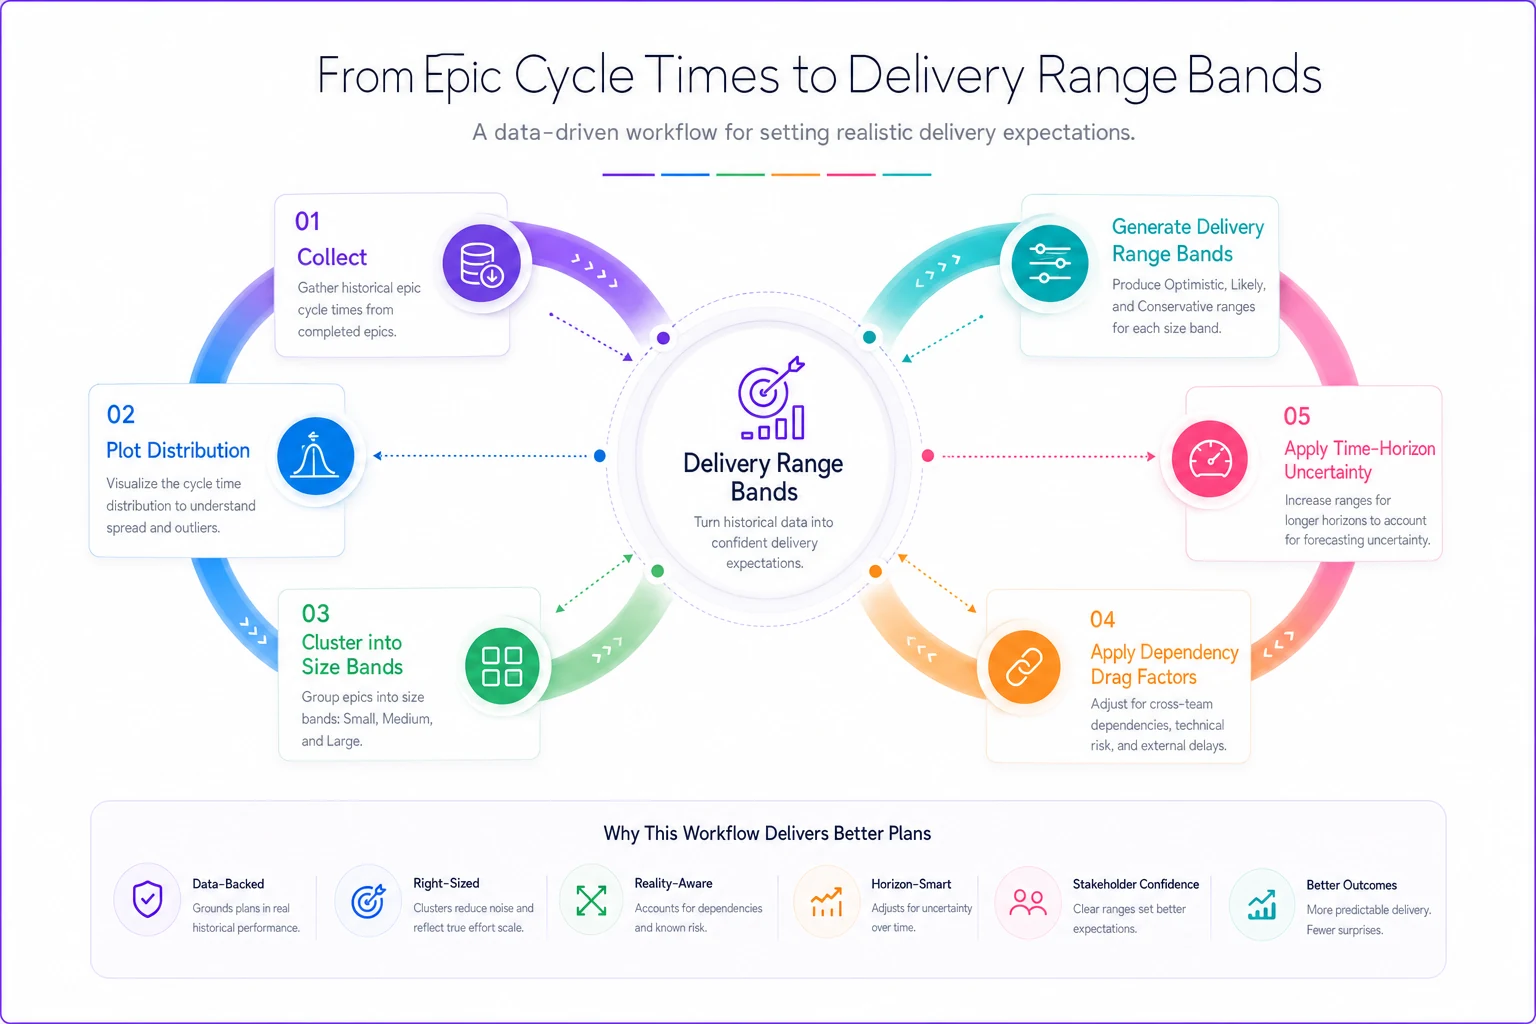
This gives stakeholders ranges they can act on instead of single misleading dates.
Dependency drag factors make the model realistic
Dependencies between teams create predictable delays, but most capacity models ignore them entirely. Add explicit drag factors based on dependency patterns.
Map each epic's dependencies into categories:
Internal dependencies (within your team): Add 10-20% to cycle time. Your backend developer waiting on your frontend developer creates friction, but it's manageable through daily coordination.
Cross-team dependencies (within your organization): Add 30-50% to cycle time. Waiting for the platform team to expose an API, coordinating with the data team on schema changes—these handoffs eat weeks.
External dependencies (vendors, partners, customers): Add 50-100% to cycle time. That payment provider integration that "should take two weeks" invariably takes six weeks after contract negotiations, security reviews, and technical discoveries.
-
Base
35-55 days
-
Internal drag (2 × 15%)
+10.5-16.5 days
-
Cross-team drag (3 × 40%)
+42-66 days
-
External drag (1 × 75%)
+26-41 days
-
Total
113-178 days
That's roughly 4-7 months for what looked like a "medium" epic. It feels pessimistic until you check your historical data and realize it's actually optimistic.
Building communication templates for different scenario bands
Raw numbers create confusion. Stakeholders hear "113-178 days" and immediately ask "but when will it really be done?" Build standard communication templates that translate uncertainty into business language.
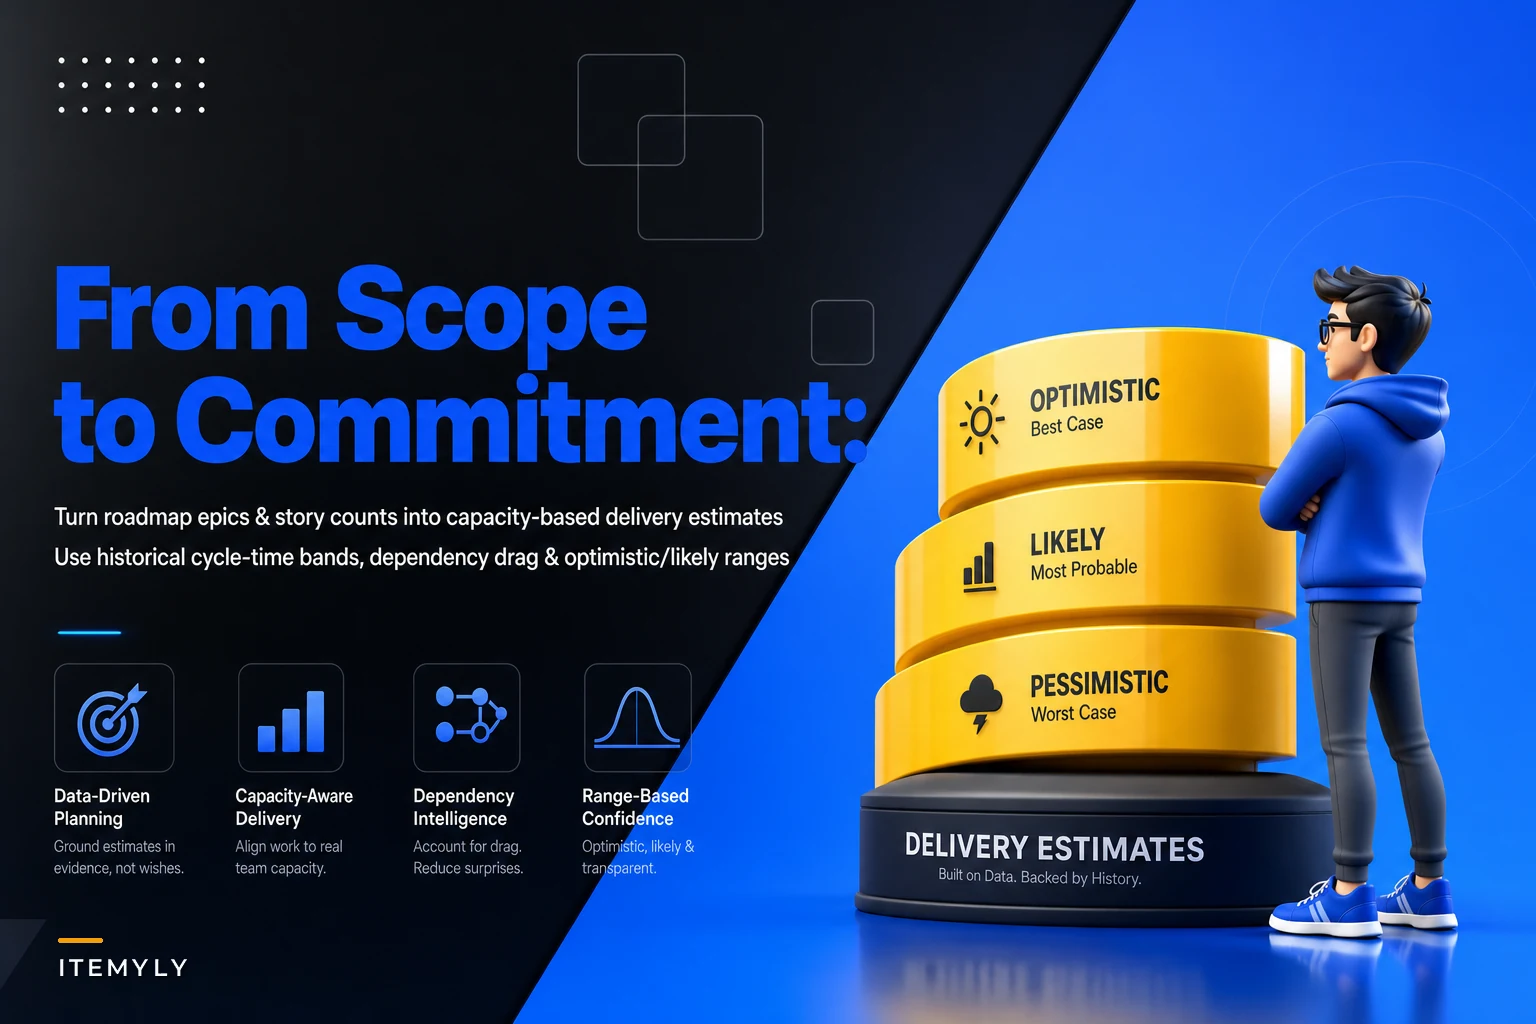
Optimistic scenario (10th percentile of your range): "If everything goes smoothly—no blocking dependencies, no scope changes, full team availability—we could deliver by [date]. This requires active executive support to fast-track decisions and remove blockers immediately when they arise."
Likely scenario (50th percentile of your range): "Based on typical delivery patterns, expect completion around [date]. This assumes normal levels of friction: some dependencies slip, minor scope adjustments, standard team availability with vacations and sick days."
Conservative scenario (90th percentile of your range): "To be confident in our commitment, we should plan for [date]. This accounts for realistic delays: key dependencies slip, scope grows moderately, team members pulled into production issues."
Never present a single date. Always present scenarios. A marketing team planning a product launch needs the conservative date. An engineering team planning follow-on work might use the likely date. Early customer conversations might reference the optimistic date with heavy caveats.
Create a simple table for each major roadmap milestone:
| Scenario | Delivery Date | Confidence | Key Assumptions |
|---|---|---|---|
| Optimistic | June 15 | 10% | No blockers, full team, scope locked |
| Likely | August 1 | 50% | Typical friction, minor scope creep |
| Conservative | September 15 | 90% | Major delays accounted for |
These templates make uncertainty actionable for different stakeholders and reduce follow-up clarification requests.
Real scenario: B2B SaaS platform's Q3 roadmap commitment
A B2B platform team needed to commit to Q3 deliverables for their enterprise customers. They had 8 epics in the pipeline—API enhancements, a new billing module, and several other features.
Using the traditional method, they counted story points (roughly 380), divided by velocity (45 points per sprint), and promised delivery in 8-9 sprints. Clean math suggested everything would ship by end of Q3.
We rebuilt their forecast using the capacity model.
Pulled cycle time data for their last 25 epics. Found three distinct clusters: small (10-20 days), medium (30-50 days), large (60-100 days).
Classified the 8 upcoming epics based on similarity to past work: 2 small, 4 medium, 2 large.
Added dependency drag. The billing module touched three external payment providers (+75% drag). The API enhancements required coordination with 4 internal teams (+40% drag each).
Applied time-horizon uncertainty. Work starting in July got a 1.2x multiplier. Work starting in September got 1.6x.
-
2 small epics
12-38 days each
-
4 medium epics
48-120 days each
-
2 large epics
130-240 days each
Total capacity needed: 446-876 days of cycle time. Available capacity in Q3: roughly 250 days (assuming single epic at a time).
The math was brutal but honest. They could confidently commit to 3-4 epics for Q3, not 8. The conservative scenario suggested only the 2 small epics and 1 medium epic would definitely ship by quarter end.
They restructured the roadmap, explicitly descoping 4 epics to Q4. Customer communications shifted from "here's everything coming in Q3" to "here's what we're confident about for Q3, and here's the sequence for Q4."
They delivered all 3 committed epics by September 20th. No surprise slips. No scrambling. No damaged customer relationships.
When to trigger model recalibration
The model degrades over time. Set explicit triggers for recalibration rather than tweaking it constantly.
Team composition changes: New hires, departures, or reorganizations invalidate historical cycle times. When team size changes by more than 20%, recalculate.
Process changes: Switching from Scrum to Kanban, adopting new tools, changing review processes—these shift cycle times significantly. After any major process change, wait 4-6 weeks for stabilization, then recalibrate.
Consistent model misses: Track prediction accuracy. If your "likely" scenarios miss by more than 30% for three consecutive epics, your underlying data has shifted.
Domain shifts: Moving from consumer features to enterprise features changes everything—complexity, stakeholder involvement, quality requirements. Treat different domains as separate models.
Quarterly recalibration typically suffices unless you hit one of the triggers above.
Who shouldn't use this model
This approach fails in certain contexts.
Early-stage startups with fewer than 10 completed epics lack the historical data. You need at least 20-30 data points for meaningful distributions. Use T-shirt sizing or pure time-boxing instead.
Research-heavy work resists cycle time prediction. ML model development, data science experiments, architectural explorations—these have fundamentally different uncertainty profiles. Use spike-based planning with fixed time boxes.
Continuous delivery teams shipping multiple times daily don't think in epics. This model assumes discrete deliverables with clear start and end points. If you deploy features behind flags continuously, track flow metrics instead.
Crisis-driven teams constantly context-switching between production fires can't maintain epic focus long enough for meaningful cycle times. Fix the operational chaos first, then implement capacity forecasting.
Converting the model into automated tracking
Manual calculation works initially but doesn't scale. Updating ranges, recalculating drag factors, generating scenarios—it burns hours every week.
This is where modern tooling helps. AI-powered operational software can pull cycle time data directly from your project management tools, automatically classify epics based on historical patterns, and calculate dependency drag by analyzing epic relationships. Instead of manually updating spreadsheets, these platforms continuously update delivery ranges as new data flows in. When an epic's dependencies slip, the model adjusts downstream forecasts automatically.
The same patterns that help filter customer feedback apply here—automated classification and scoring reduces manual overhead while improving consistency.
The bigger win is scenario modeling at scale. Want to know what happens if you pull two engineers for a production issue? The model recalculates all affected delivery ranges immediately. Considering adding scope to an in-flight epic? You see the cascade effects across your entire roadmap before committing.
Several product teams now run their entire capacity planning through automated platforms that combine historical analysis, Monte Carlo simulation, and dependency tracking. What used to require weekly planning meetings updates continuously in the background.
The psychological shift from precision to ranges
The hardest part isn't building the model—it's changing what people expect from it.
Executives want precise dates. "Sometime between June and September" feels like dodging commitment. But false precision does more damage than acknowledged uncertainty. When you promise June 15th and deliver September 15th, trust erodes. When you promise "50% confidence by August 1st, 90% confidence by September 15th" and deliver September 10th, you build credibility.
Start with small wins. Pick one epic, forecast it using ranges, track carefully. When it delivers within your conservative band, point to it. Build confidence that ranges outperform false precision.
Train stakeholders to ask different questions. Instead of "when will it be done?" get them asking "what confidence level do we need for this commitment?" A conference demo needs 95% confidence. An internal pilot might accept 60%.
Some teams build this into their operational culture by displaying roadmap items as horizontal bars showing the full delivery range, not single milestone dates. The visual representation makes uncertainty tangible and normal rather than something to hide.
The model is a conversation starter, not an oracle
Capacity forecasting for roadmaps will never achieve perfect accuracy. Market conditions shift, priorities change, unexpected things disrupt everything. The goal isn't prediction—it's informed conversation.
When you show a 130-240 day range for a large epic, the valuable discussion isn't about narrowing the range. It's about whether the business can accept that uncertainty, how to break the epic into smaller deliverables, which dependencies to eliminate, whether the value justifies the investment.
The model surfaces uncomfortable truths early. That ambitious Q4 roadmap mathematically cannot fit within team capacity. That critical enterprise feature has too many external dependencies to guarantee a delivery date. That technical debt cleanup will definitely impact feature velocity.
By acknowledging uncertainty explicitly, you shift from defending broken promises to managing realistic expectations. Product management becomes less about heroic scrambles and more about systematic capacity allocation.
Start simple. Track cycle times for your next 10 epics. Plot the distribution. Add basic dependency counts. Calculate ranges instead of points. Watch how conversations change when you present scenarios instead of false certainty.
Teams that master capacity forecasting don't deliver faster. They deliver predictably. And in product management, predictability builds trust, trust enables autonomy, and autonomy accelerates everything else.
Ready to elevate your product management?
Join 2,000+ product teams using Itemyly to accelerate delivery, improve alignment, and build better products.