



Most mid‑market product teams hit this fork at roughly the same headcount: somewhere past 80 people, two or three product lines, a sales team that keeps promising features in deals, and release velocity that nobody can actually measure. You have budget for one real tooling investment this quarter. The two candidates are almost always some flavor of release analytics (instrumentation to understand what shipped, adoption, regression, funnel impact) versus stakeholder collaboration and public roadmap tooling (shared roadmaps, voting portals, changelog/feedback loops).
The mistake teams make is treating this as a philosophical debate — "are we data-driven or customer-driven?" — when it's actually a sequencing decision based on where your biggest leak is. One of these tools fixes a measurement gap. The other fixes a coordination and expectation gap. They solve different failures, and buying the wrong one first wastes a quarter you can't get back.
This playbook gives you a weighted scoring rubric with two worked examples, pilot plans for either path, a TCO/ROI template, and the integration checklist for when you eventually run both.
Start with the leak, not the category
Before you compare vendors, name the failure mode that's actually costing you. The release analytics vs public roadmap decision splits cleanly along two questions:
-
Do you know what happens after you ship? If feature adoption, regression detection, and funnel impact are guesses, your leak is measurement. Release analytics.
-
Do your stakeholders know what's coming, and do you know what they want? If sales is blindsided, customers churn over "where's feature X," and your backlog is a shouting match, your leak is coordination. Roadmap/collaboration tooling.
A diagnostic that tends to cut through the noise: look at your last five postmortems and your last five churned accounts. If postmortems keep surfacing things like "we didn't notice the regression" or "adoption was flat and we had no idea," that's an analytics leak. If churn notes say "customer felt ignored" or "expected a feature that never came," that's a roadmap leak. Whichever bucket has more entries is where you spend first.
The weighted decision‑scoring rubric
Score each option 1–5 on the criteria below, multiply by the weight, and total. The weights are a starting point — adjust them to your situation, but adjust them before you score so you're not reverse-engineering the result toward a vendor you already prefer.
Eliminate product chaos and align your team.
Itemyly helps you plan, prioritize, and track every product milestone seamlessly.
- Centralized roadmap management
- Stakeholder collaboration
- Release tracking & analytics
No credit card required
| Criterion | Weight | What a 5 looks like |
|---|---|---|
| Size of the current leak (revenue/churn at risk) | 25% | Directly tied to money bleeding now |
| Time‑to‑first‑value | 15% | Useful signal within the pilot window |
| Instrumentation readiness | 15% | Events/telemetry already mostly exist |
| Stakeholder pain intensity | 15% | Execs/sales actively complaining |
| Internal ownership available | 10% | A named owner with real capacity |
| Integration cost into current stack | 10% | Fits existing event bus / CRM cleanly |
| Reversibility (can you unwind it) | 10% | Low lock‑in, exportable data |
Total each option. A gap under roughly 0.4 points means it's genuinely close — pick the one with faster time‑to‑value and revisit in two quarters.
Worked example 1 — PLG mid‑market SaaS (~140 employees, self‑serve + some sales‑assist)
| Criterion | Weight | Release Analytics | Public Roadmap |
|---|---|---|---|
| Leak size | 25% | 5 (1.25) | 3 (0.75) |
| Time‑to‑first‑value | 15% | 4 (0.60) | 3 (0.45) |
| Instrumentation readiness | 15% | 3 (0.45) | 4 (0.60) |
| Stakeholder pain | 15% | 3 (0.45) | 3 (0.45) |
| Ownership available | 10% | 4 (0.40) | 3 (0.30) |
| Integration cost | 10% | 3 (0.30) | 4 (0.40) |
| Reversibility | 10% | 4 (0.40) | 4 (0.40) |
| Total | 3.85 | 3.35 |
Verdict: Release analytics first. For PLG, the money is in the activation and expansion funnel, and they're flying blind there. The public roadmap matters, but it's not where revenue is leaking this quarter.
Worked example 2 — Enterprise‑facing mid‑market SaaS (~300 employees, sales‑led)
| Criterion | Weight | Release Analytics | Public Roadmap |
|---|---|---|---|
| Leak size | 25% | 3 (0.75) | 5 (1.25) |
| Time‑to‑first‑value | 15% | 3 (0.45) | 4 (0.60) |
| Instrumentation readiness | 15% | 2 (0.30) | 4 (0.60) |
| Stakeholder pain | 15% | 3 (0.45) | 5 (0.75) |
| Ownership available | 10% | 3 (0.30) | 4 (0.40) |
| Integration cost | 10% | 3 (0.30) | 4 (0.40) |
| Reversibility | 10% | 4 (0.40) | 4 (0.40) |
| Total | 2.95 | 4.40 |
Verdict: Collaboration/roadmap tooling first. The leak here is trust and expectation management in renewal‑driving accounts. Enterprise buyers churn over broken roadmap promises far more than over adoption metrics they never look at. Analytics comes second, once the sales‑product feedback loop has a home.
The pattern across both examples: PLG leans analytics‑first, enterprise‑facing leans roadmap‑first. Not a hard rule, but a strong prior. If your scores contradict it, double‑check that your leak‑size score is honest.
Pilot playbook A — Release analytics (8–12 weeks)
Run this as a real pilot with a kill switch, not an open‑ended rollout.
Roles
-
Pilot owner (PM or product ops) — owns scope and the go/no‑go call
-
Analytics engineer or data‑savvy dev — owns instrumentation
-
One design partner squad — the team whose releases you'll measure
-
An exec sponsor who reviews results at weeks 4 and 10
Instrumentation (minimum viable telemetry)
-
Release/version identifier attached to every relevant event
-
Core adoption events for 2–3 target features (not everything — pick the ones tied to revenue)
-
A funnel definition
activation → core action → expansion trigger
-
An error/regression signal you can correlate to release IDs
Weekly shape
-
Weeks 1–2
define 2–3 questions the pilot must answer; wire events; QA the data
-
Weeks 3–6
ship 2–3 releases through the instrumented pipeline; watch adoption and regression
-
Weeks 7–10
run at least one proper A/B or before/after comparison on a real release
-
Weeks 11–12
write up findings, decide buy/expand/kill
Success metrics
-
Time from release to a trustworthy adoption read drops from "we never really know" to under a week
-
At least one release decision changed because of the data (rollback, iterate, double‑down)
-
Regression caught earlier than it would have been manually
Statistical guidance: Don't eyeball dashboards and declare victory. For a before/after on a conversion‑style metric, estimate your required sample up front. A rough rule: to spot a change from around 20% to 24% at 80% power, you're looking at low‑thousands of users per arm. Use a proper sample‑size calculator (Evan Miller's, or statsmodels' proportion_effectsize + NormalIndPower) and commit to the number before you peek. Peeking early and stopping on a good day is the most common way mid‑market teams fool themselves with analytics data.
Pilot playbook B — Public roadmap / stakeholder collaboration (8–12 weeks)
Roles
-
Pilot owner (PM or product ops)
-
A sales/CS partner who'll actually route customer input through the tool
-
A comms owner for external‑facing roadmap hygiene
-
Exec sponsor for the "what do we commit to publicly" calls
Instrumentation (lighter, but real)
-
Feedback intake tagged by account, ARR band, and request theme
-
Roadmap items mapped to statuses with explicit commitment tiers
-
A changelog/announcement loop so shipped items visibly close
-
Tracking of which requests came from which revenue segment
Weekly shape
-
Weeks 1–2
define commitment tiers (exploring / planned / building / shipped) and who can promise what
-
Weeks 3–5
migrate top requests, onboard sales/CS, start routing live feedback
-
Weeks 6–9
publish the external roadmap to a controlled set of accounts
-
Weeks 10–12
measure stakeholder response, assess internal adoption, decide
Success metrics
-
Reduction in "where's feature X" escalations hitting the product team directly
-
Sales/CS logging feedback in‑tool instead of Slack DMs and hallway asks
-
A measurable share of roadmap items now traceable to account/ARR context
-
Fewer roadmap‑trust issues flagged in renewal notes (a lagging metric — watch it over two quarters)
A caution on public commitments: the moment a roadmap goes external, it becomes a soft contract. Keep "exploring" genuinely non‑committal and reserve dates for things already in build. More teams get burned by over‑promising on a public roadmap than by sharing too little.
Public‑roadmap hygiene (the part teams skip)
If you go the roadmap route, hygiene is what separates a trust‑builder from a liability. Teams consistently underinvest in this — they spend three weeks configuring the tool and about forty-five minutes thinking through governance.
-
Commitment tiers, visibly labeled. Never show a date on anything not actively being built.
-
Expiry on stale items. Anything in "planned" for 2+ quarters gets re‑reviewed or removed.
-
One owner per public item. No orphaned promises.
-
A changelog that closes the loop. Shipped items must visibly move to shipped — this is where you earn credibility back.
-
A quarterly scrub. Walk the whole public board and kill, update, or re‑commit every item.
The scrub sounds tedious. It is. But a public roadmap with six items stuck in "planned" for eight months does more damage than no public roadmap at all. Run the scrub anyway.
ROI / TCO template with example numbers
Both tools have real total cost beyond the license. Model it honestly.
TCO components
-
License (annual)
-
Implementation/integration labor (one‑time, in loaded engineering hours)
-
Ongoing maintenance (hours/month × loaded rate)
-
Internal training/change cost
-
Opportunity cost of the owner's time
Worked example — release analytics, ~200‑person PLG SaaS
-
License
~$28k–$36k/year
-
Implementation
~120 eng hours × ~$120 loaded = ~$14k one‑time
-
Ongoing
~8 hrs/month × $120 ≈ ~$11.5k/year
-
First‑year TCO
roughly $55k–$62k
Return side: if better regression detection and adoption reads let you avoid one meaningful botched release and reallocate roughly 15% of a squad's effort away from features nobody's actually using, the recovered capacity alone tends to land in the low‑to‑mid six figures of effective value for a team that size. Even on conservative assumptions, first‑year return clears TCO. The softer win — fewer "we shipped it and nobody noticed" cycles — is harder to price but real.
Worked example — roadmap tooling, ~300‑person enterprise SaaS
-
License
~$18k–$24k/year
-
Implementation
~60 eng hours + CS/sales onboarding ≈ ~$9k one‑time
-
Ongoing
~6 hrs/month ≈ ~$8.6k/year
-
First‑year TCO
roughly $35k–$42k
Return side: this one is renewal‑anchored. If roadmap trust influences even a couple of six‑figure renewals that were wobbling, the math isn't close — the tool pays for itself many times over. The honest caveat: that attribution is fuzzy, so track roadmap‑related churn reasons before and after rather than claiming every save.
One macro factor worth folding into the TCO conversation: infrastructure and financing costs move, and when they do, tooling budgets get re‑examined fast. It's worth reading how teams reprioritize when rate signals push cloud and operating costs up before you lock in a multi‑year license.
When you eventually run both: the integration checklist
Most teams land here within a year — analytics and roadmap tooling. The value multiplies when roadmap items are backed by adoption data, but only if you wire the minimal telemetry to connect them.
-
[ ] Shared feature/identifier taxonomy so a roadmap item maps to its analytics events
-
[ ] Account/ARR context flows into both systems (usually via the CRM as source of truth)
-
[ ] Shipped roadmap items auto‑link to their adoption dashboard
-
[ ] Feedback volume per item surfaces alongside its usage data
-
[ ] One canonical "feature" ID used across analytics, roadmap, and changelog
-
[ ] Clear data‑ownership boundary (who owns the event schema vs who owns roadmap status)
If you can't maintain a consistent feature ID across tools, don't integrate yet — you'll create two sources of truth that quietly disagree, which is worse than one incomplete source.
Below is a simple workflow linking roadmap items to analytics so teams can follow the integration path visually.
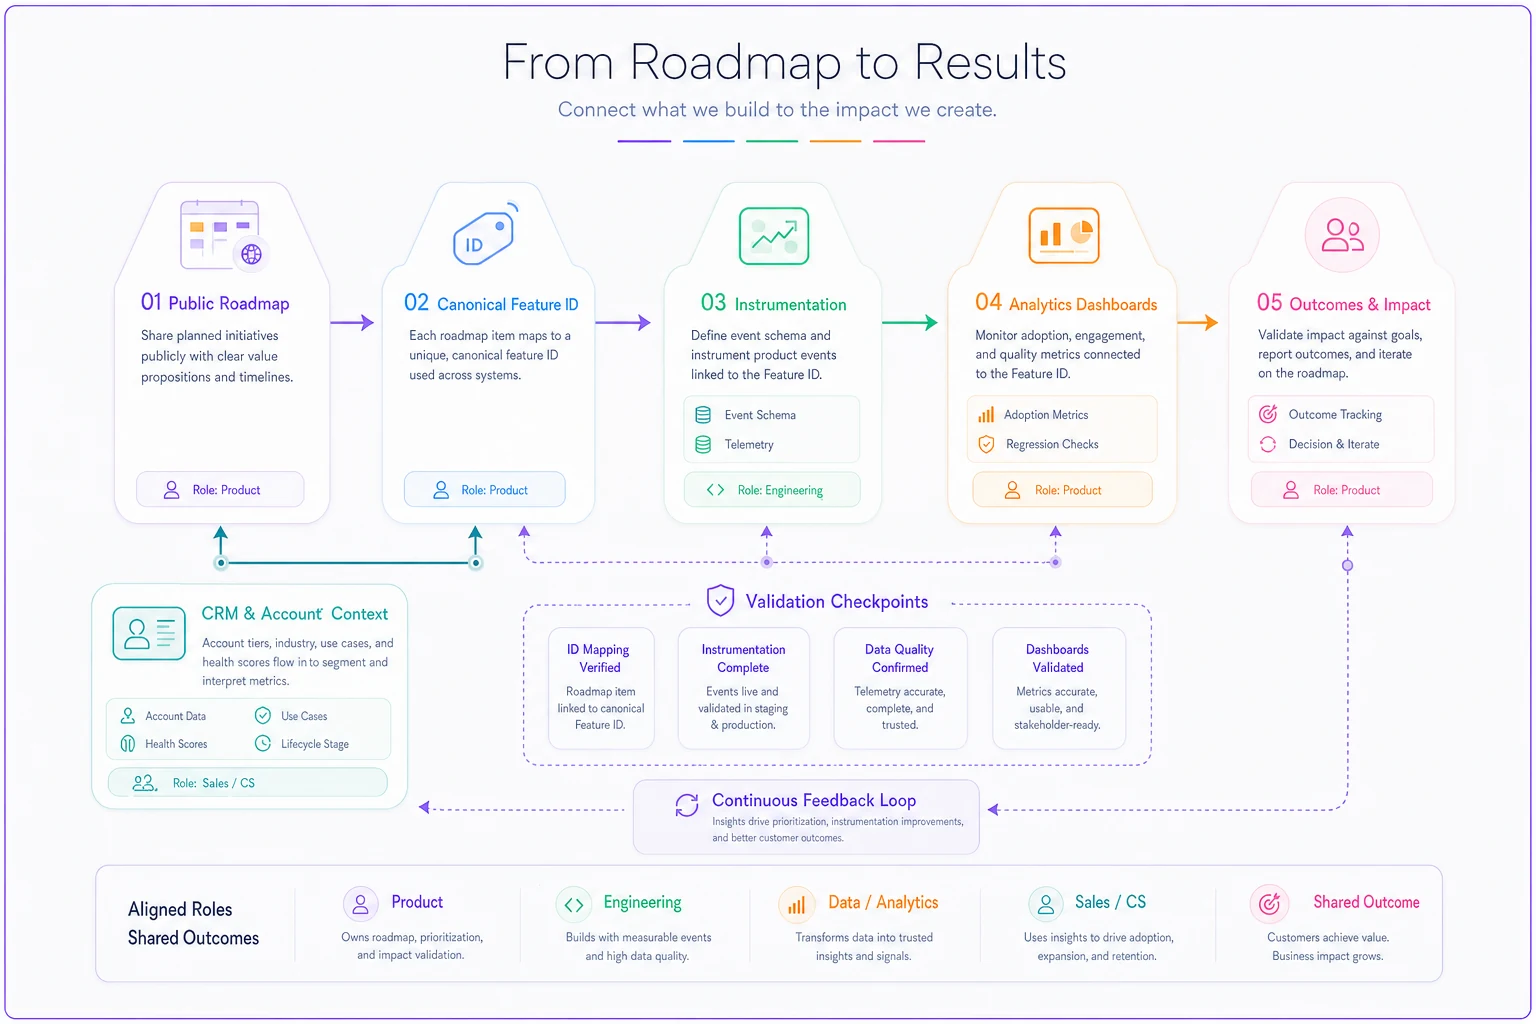
Start a canonical feature ID list during the pilot so roadmap and analytics map cleanly.
Use this workflow as a checklist: map IDs, route account context, and only then auto‑link shipped items to dashboards.
Governance and role responsibilities
A lightweight RACI keeps either tool from rotting:
| Activity | Product | Product Ops | Sales/CS | Eng/Data |
|---|---|---|---|---|
| Event schema / taxonomy | C | A | I | R |
| Roadmap status & commitment tier | A/R | C | C | I |
| Public roadmap publishing | A | R | C | I |
| Feedback intake & tagging | C | A | R | I |
| Experiment design & readout | A/R | C | I | C |
The one governance rule that matters most: no public commitment tier changes without the named owner and the exec sponsor both signing off. That single gate prevents most of the roadmap‑trust damage teams quietly inflict on themselves.
Vendor evaluation criteria
Score vendors on these, not on demo polish:
-
Data exportability — can you leave with your data intact?
-
Time‑to‑first‑value in a real pilot, not a sandbox
-
Integration with your actual event bus and CRM, verified, not promised
-
Commitment‑tier modeling (for roadmap tools) — does it support non‑committal states?
-
Statistical rigor (for analytics tools) — real significance testing, not just pretty charts
-
Pricing that doesn't balloon with seats or events at your growth rate
-
Support responsiveness during the pilot — it only gets slower after you sign
Support responsiveness during the pilot — it only gets slower after you sign
Who should *not* buy either yet
Teams under roughly 50 people with a single product and a roadmap that fits in one person's head don't need either of these yet. A spreadsheet and a shared doc still beat the overhead.
-
Teams with no named owner will watch both tools die quietly. An unowned analytics instance becomes a graveyard of dashboards nobody trusts. An unowned roadmap becomes a wall of stale promises that sales eventually stops referencing because it's never accurate.
-
And if your instrumentation is so broken that an analytics tool would just surface garbage faster — fix the event layer first. Buying a better telescope doesn't help if you're pointing it at the wrong part of the sky.
Teams with no named owner will watch both tools die quietly. An unowned analytics instance becomes a graveyard of dashboards nobody trusts. An unowned roadmap becomes a wall of stale promises that sales eventually stops referencing because it's never accurate.
The short version
The release analytics vs public roadmap choice isn't about values — it's about which leak is costing you more right now. PLG and self‑serve businesses usually bleed in the adoption funnel they can't see, so analytics earns the first dollar. Enterprise‑facing businesses usually bleed in renewal‑driving trust, so roadmap and collaboration tooling earns it.
Score it honestly with the rubric, run a real pilot with a kill switch, model the full TCO instead of just the license, and plan the integration before you own both. Pick the leak, run the pilot, keep the kill switch, and when the two tools finally meet, make sure they agree on what a "feature" is before you let them talk to each other.
The release analytics vs public roadmap choice isn't about values — it's about which leak is costing you more right now. PLG and self‑serve businesses usually bleed in the adoption funnel they can't see, so analytics earns the first dollar. Enterprise‑facing businesses usually bleed in renewal‑driving trust, so roadmap and collaboration tooling earns it.
Ready to elevate your product management?
Join 2,000+ product teams using Itemyly to accelerate delivery, improve alignment, and build better products.