


Most teams don't actually have a prioritization problem. They have a framework‑mismatch problem. They picked RICE because a blog told them to, or inherited a weighted scorecard from a PM who left two years ago, and now they're applying it to decisions the framework was never built to handle. Then everyone argues about why the top‑ranked item "feels wrong."
So instead of pitching one winner, this is a comparison. Three common prioritization frameworks — RICE, a weighted Outcome+Effort+Risk model, and OKR‑aligned scoring — run against the exact same backlog. Same three candidate features, same assumptions, three different rankings. That's the whole point: the framework changes the answer, and you need to know which answer you actually want before you start scoring anything.
I'll cover the formulas (including run‑cost variants that matter more now that infra bills don't shrink), normalization guidance, default weights worth stealing, a light governance process so scores don't rot, and sensitivity checks so you can spot the one input that's secretly driving everything.
The three frameworks, and what each one is quietly optimizing for
Before the math, it helps to name what each framework is biased toward, because that bias is exactly why rankings diverge.
RICE optimizes for throughput of value per unit of effort. Reach × Impact × Confidence, divided by Effort. It's great at surfacing high‑volume, low‑cost wins. Its blind spot: it mostly ignores risk and strategic fit. A feature that touches a million users but pulls you sideways from your quarterly objective will still rank high.
Weighted Outcome+Effort+Risk is the most tunable of the three. You explicitly score outcome, effort, and risk, apply weights, and combine. It's the one most teams think RICE is. Its strength is that risk is a first‑class citizen — compliance exposure, operational fragility, run‑cost blowups. Its weakness is that weights are where politics hide. Whoever sets the weights sets the roadmap.
OKR‑aligned scoring optimizes for strategic coherence. Each candidate is scored on how directly it moves a committed objective's key results. It's the right tool when leadership has made real bets and you need the backlog to reflect them. Its blind spot: it can starve high‑value maintenance and "boring" infra work that doesn't map neatly to a flashy KR.
Quick comparison:
| Dimension | RICE | Weighted O+E+R | OKR‑Aligned |
|---|---|---|---|
| Core bias | Value per effort | Balanced, tunable | Strategic fit |
| Handles risk? | Poorly | Explicitly | Indirectly |
| Handles run‑cost? | Only via effort | Yes, if modeled | Rarely |
| Best for | Growth backlogs, many small bets | Mixed backlogs with real risk | Committed quarterly bets |
| Main failure mode | Ignores strategy & risk | Weight politics | Starves maintenance |
| Setup cost | Low | Medium | Medium‑high |
Quick comparison:
Sample formulas (including the run‑cost variants most teams skip)
RICE, standard
Eliminate product chaos and align your team.
Itemyly helps you plan, prioritize, and track every product milestone seamlessly.
- Centralized roadmap management
- Stakeholder collaboration
- Release tracking & analytics
No credit card required
RICE = (Reach × Impact × Confidence) / Effort
-
Reach
users or events per time window (e.g., per quarter)
-
Impact
a fixed scale — 3 = massive, 2 = high, 1 = medium, 0.5 = low, 0.25 = minimal
-
Confidence
percentage, 100% / 80% / 50%
-
Effort
person‑months (or person‑weeks — pick one and never mix)
RICE, run‑cost adjusted
Classic RICE Effort only counts build cost. That's a problem when a feature is cheap to build and expensive to run forever — which describes basically every AI or consumption‑metered feature now. A simple fix is folding ongoing cost into the denominator:
RICE_rc = (Reach × Impact × Confidence) / (Effort + (MonthlyRunCost × AmortMonths))
Where AmortMonths is however long you want to amortize run‑cost over (12 is a reasonable default). Keep units consistent: convert run‑cost into effort‑equivalent units, or keep everything in dollars. Don't half‑convert — that's the single most common scoring bug I see.
Weighted Outcome+Effort+Risk
Score = (wo × Outcome) − (we × EffortNorm) − (w_r × Risk)
-
Each term scored 0–10 after normalization.
-
Recommended default weights to start from
-
w_o(outcome) = 0.5 -
w_e(effort) = 0.3 -
w_r(risk) = 0.2 -
Risk here should bundle delivery risk, operational load, and run‑cost volatility. If your infra bills swing with usage, treat cost unpredictability as a risk input, not just an effort input. Teams reprioritizing after infra cost shocks — the exact situation covered in When the Fed Signals Higher Rates: How Product Teams Should Reprioritize Roadmaps and Control Cloud Costs — usually find that bumping
wrto 0.3 and droppingwoto 0.4 quietly re‑sorts the whole backlog toward cheaper‑to‑operate work.
OKR‑aligned scoring
AlignScore = Σ (KRcontributioni × KRweighti) × Confidence
For each key result the feature touches, estimate its contribution (0–1 of the remaining gap it closes) times that KR's importance weight (weights across KRs sum to 1). Multiply by confidence. Simple, but it forces an honest conversation: "how much of KR‑2 does this actually close?" You'd be surprised how often the answer is "almost none."
Normalization and units — the boring part that breaks everything
The fastest way to get a nonsense ranking is to add numbers that live on different scales. A Reach of 400,000 and an Impact of 3 can't share a formula with an Effort of 2 unless you normalize first.
A few rules worth hard‑coding into your process:
-
Pick one effort unit and freeze it. Person‑weeks or person‑months, never both in the same sheet.
-
Normalize to 0–10 for weighted models. Min‑max within the current batch works fine:
norm = 10 × (value − min) / (max − min). Re‑normalize per scoring round, not once forever. -
Keep money as money. If you're doing run‑cost variants, resist converting dollars into "effort points." Keep a dollar column and an effort column separate, then combine deliberately.
-
Cap outliers before normalizing. One feature with 10× the reach of everything else will flatten the entire scale. Winsorize at the 90th percentile.
Re‑normalize per scoring round, not once forever.
The pattern that trips teams up most: they normalize Reach but forget Impact is already a fixed scale, so they double‑compress one dimension. Decide for each input whether it's already bounded (Impact, Confidence) or needs normalizing (Reach, Effort, Cost).
Worked example: three features, three frameworks, three different winners
Three candidates sitting in the same quarter's backlog:
-
Feature A — Self‑serve CSV export. Broad, cheap, low strategic value.
-
Feature B — AI summary in the inbox. Narrower reach, high impact, expensive to run, moderate compliance risk.
-
Feature C — SSO for enterprise. Low reach, high strategic value (tied to an enterprise‑expansion objective), moderate effort, low risk.
Raw inputs:
| Input | A: CSV export | B: AI summary | C: SSO |
|---|---|---|---|
| Reach (users/qtr) | 40,000 | 9,000 | 1,200 |
| Impact | 1 | 3 | 2 |
| Confidence | 90% | 60% | 85% |
| Effort (person‑months) | 2 | 5 | 4 |
| Monthly run‑cost | ~$150 | ~$2,800 | ~$200 |
RICE (standard)
-
A
(40,000 × 1 × 0.9) / 2 = 18,000
-
B
(9,000 × 3 × 0.6) / 5 = 3,240
-
C
(1,200 × 2 × 0.85) / 4 = 510
Ranking: A ≫ B ≫ C. CSV export crushes everything. Reach dominates, as it always does in vanilla RICE.
RICE, run‑cost adjusted (AmortMonths = 12, converting cost to effort at ~$20k/person‑month)
Effort‑equivalent of run‑cost = (MonthlyRunCost × 12) / 20,000:
-
A
extra ≈ 0.09 → denom 2.09 → 17,225
-
B
extra ≈ 1.68 → denom 6.68 → 2,425
-
C
extra ≈ 0.12 → denom 4.12 → 495
Ranking unchanged (A ≫ B ≫ C), but B takes a real haircut — its score drops roughly 25% once you price in the run‑cost. On a tighter backlog, that swing is enough to flip B below other mid‑tier items.
Weighted O+E+R (defaults 0.5 / 0.3 / 0.2, normalized 0–10)
Normalizing within the batch (outcome ≈ Reach×Impact×Confidence, effort, and a risk score of A=2, B=7, C=3 out of 10):
-
Outcome norm
A=10, B=1.1, C=0 (A dominates raw outcome)
-
Effort norm
A=0, B=10, C=6.7
-
Score = 0.5·O − 0.3·E − 0.2·R
-
A
0.5·10 − 0.3·0 − 0.2·2 = 4.6
-
B
0.5·1.1 − 0.3·10 − 0.2·7 = −3.85
-
C
0.5·0 − 0.3·6.7 − 0.2·3 = −2.61
Ranking: A ≫ C ≫ B. Notice B and C flipped versus RICE. Once risk and effort carry real weight, the expensive, compliance‑tinged AI feature falls to last.
OKR‑aligned
Say the committed objective is enterprise expansion, with KRs: KR1 = add 20 enterprise logos (weight 0.6), KR2 = reduce enterprise churn (weight 0.4).
-
A (CSV export)
touches nothing enterprise‑specific → ≈ 0.1 contribution overall → ~0.08
-
B (AI summary)
mild churn help → KR2 contribution ~0.2 → 0.2×0.4×0.6 conf ≈ ~0.05
-
C (SSO)
blocks enterprise deals → KR1 contribution ~0.5 → 0.5×0.6×0.85 ≈ ~0.26
Ranking: C ≫ A ≫ B. The feature that finished dead last in RICE now wins decisively, because it's the only one actually moving the bet leadership committed to.
| Framework | Winner | Loser |
|---|---|---|
| RICE | A (CSV) | C (SSO) |
| Weighted O+E+R | A (CSV) | B (AI) |
| OKR‑aligned | C (SSO) | B (AI) |
This is the whole argument. If your quarter is defined by an enterprise bet, RICE will actively point you at the wrong feature. If you've got a clean growth backlog with no strategic constraints, OKR scoring will feel like bureaucratic overhead. The framework is a decision before you score anything.
When each framework actually makes sense
Use RICE when:
-
You have many small, independent features
-
Reach is measurable and trustworthy
-
There's no single dominant strategic constraint this quarter
-
Risk and run‑cost are genuinely low across candidates
Use Weighted O+E+R when:
-
Candidates vary a lot in risk or operational load
-
Run‑cost matters (AI features, data‑heavy work, metered infra)
-
You need a defensible, tunable score for mixed backlogs
-
You can resist rigging the weights
Use OKR‑aligned when:
-
Leadership has committed to specific, measurable bets
-
You need the backlog to visibly serve those bets
-
Cross‑team alignment matters more than raw throughput
Who shouldn't bother with any of this
If your backlog is ten items and everyone already agrees on the top three, skip it. Scoring frameworks earn their keep at scale and in disagreement. A five‑person team ranking five obvious things with a weighted model is just theater with a spreadsheet.
A light governance process so scores don't rot
Scores decay. Confidence estimates go stale, run‑costs drift, objectives shift mid‑quarter. A minimal process keeps them honest:
-
Fix the framework per planning cycle, not per feature. Choose one (or a primary plus a tie‑breaker) at the start of the quarter so nobody shops frameworks to get their pet feature on top.
-
Separate the scorer from the advocate. The person requesting a feature shouldn't set its own confidence. Have a second PM sanity‑check inputs.
-
Log the inputs, not just the output. Store Reach, Impact, Confidence, and the assumption behind each. When a score looks wrong later, you want the why.
-
Re‑normalize every round. Never carry last quarter's normalized scale into this quarter.
-
Timebox the debate. Scores inform the decision; they don't make it. Cap the argument at one session.
A quick governance checklist to run before you trust a ranking:
-
[ ] One effort unit used everywhere
-
[ ] Confidence set by someone other than the requester
-
[ ] Run‑cost included for any metered/AI feature
-
[ ] Inputs logged with assumptions
-
[ ] Outliers capped before normalizing
-
[ ] Framework chosen before scores were calculated
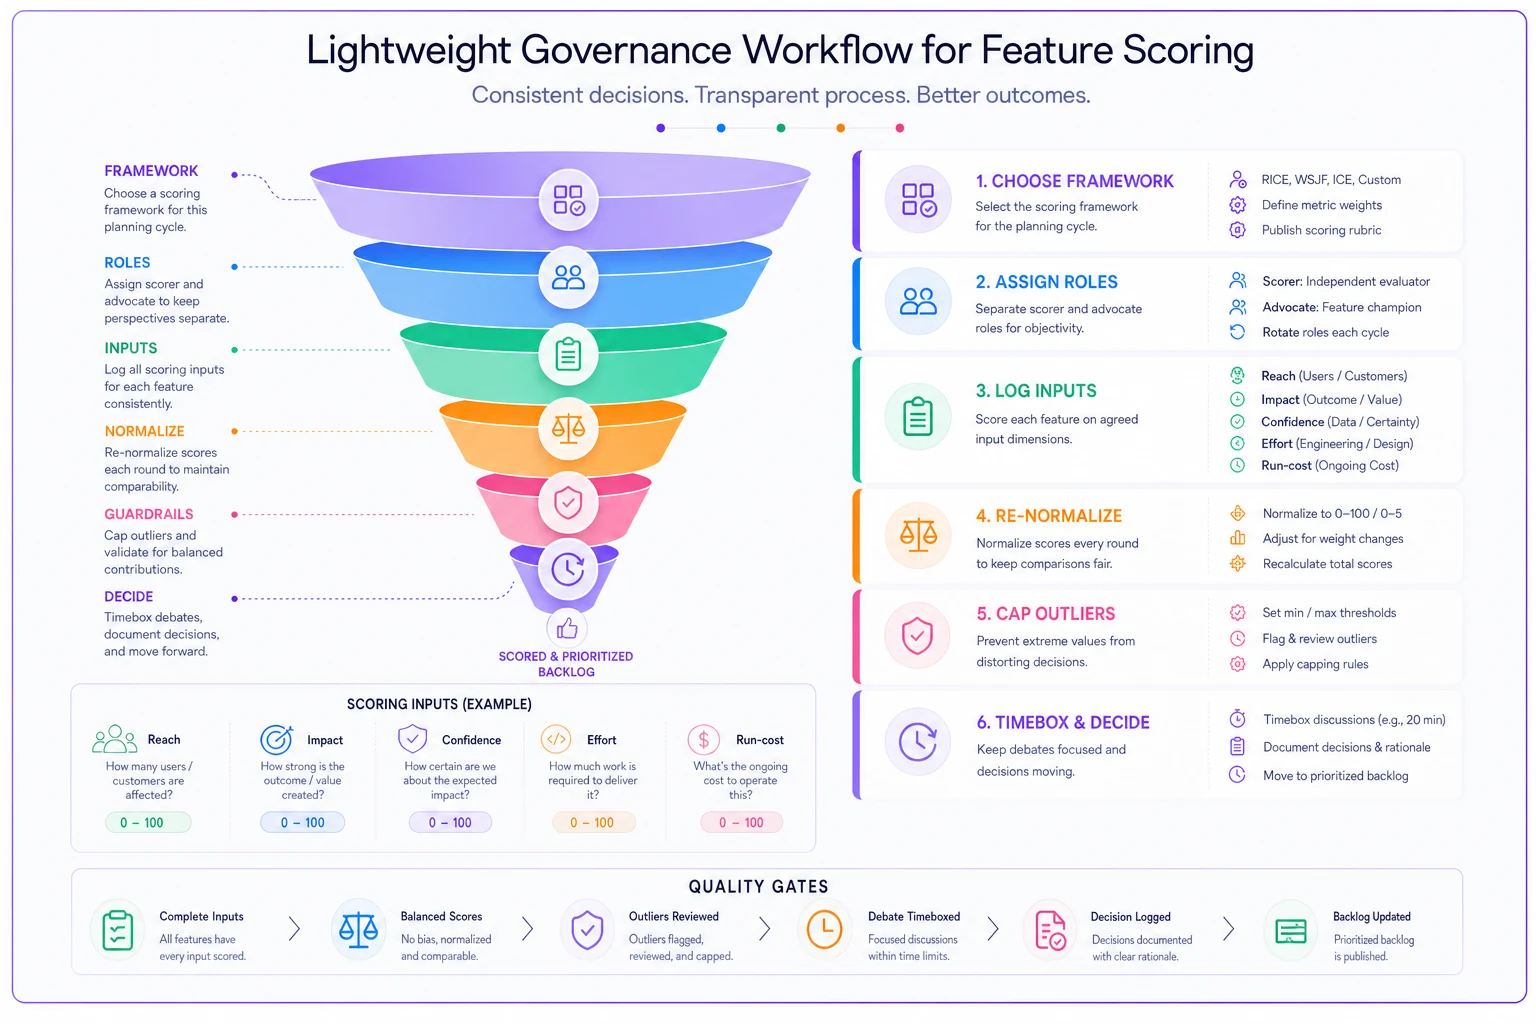
This flow shows a minimal scoring governance: pick the framework per cycle, separate scorer and advocate, log inputs, re‑normalize every round, cap outliers, and timebox the debate.
Sensitivity checks: find the one input driving everything
The dangerous ranking isn't the wrong one — it's the fragile one that flips if a single guess is slightly off. Two cheap checks catch most of this.
Confidence swing. Re‑run with every confidence knocked down one notch (90→80, 80→50). If the ranking holds, it's robust. If #1 and #2 swap, your top choice is resting on an optimistic guess. In the worked example, Feature B's weighted score is so negative that no realistic confidence bump saves it — that's a stable loss. Worth knowing before you spend a quarter arguing about it.
Single‑input dominance. Zero out or halve the largest single input and see what happens. RICE rankings almost always collapse onto Reach — in the example above, halving A's reach still leaves it on top, which tells you Reach really is the story there. If one input moving ±20% reorders your backlog, say so out loud before committing. That's not a flaw in the math; it's information about where your uncertainty actually lives.
The mistake isn't choosing RICE over weighted scoring or OKR alignment. The mistake is choosing without noticing that each one is answering a different question — most value per effort, best risk‑adjusted bet, or most strategically coherent. Run the same three features through all three and you get three different winners, which means the framework selection is doing more work than the scoring itself.
Pick the framework that matches the question your quarter is actually asking. Fold run‑cost into the math wherever usage drives your bills, because build cost alone stopped telling the full story a while ago. Keep the inputs honest with a thin governance layer, and stress‑test the top of your list before you commit a team to it. Do that, and the arguments about why the top item "feels wrong" mostly disappear — because you'll have already chosen which flavor of right you were after.
Ready to elevate your product management?
Join 2,000+ product teams using Itemyly to accelerate delivery, improve alignment, and build better products.